Actual vs plan vs last year in one Power BI bar chart: the DAX, the ranks and the traps
Every monthly review has the same question per site, product line or customer: are we ahead of plan, are we ahead of last year, and who moved? The answer usually ends up spread over three visuals: a bar chart of revenue, a table of variances and a card with last year. The reader then lines up Chicago in one visual with Chicago in another.
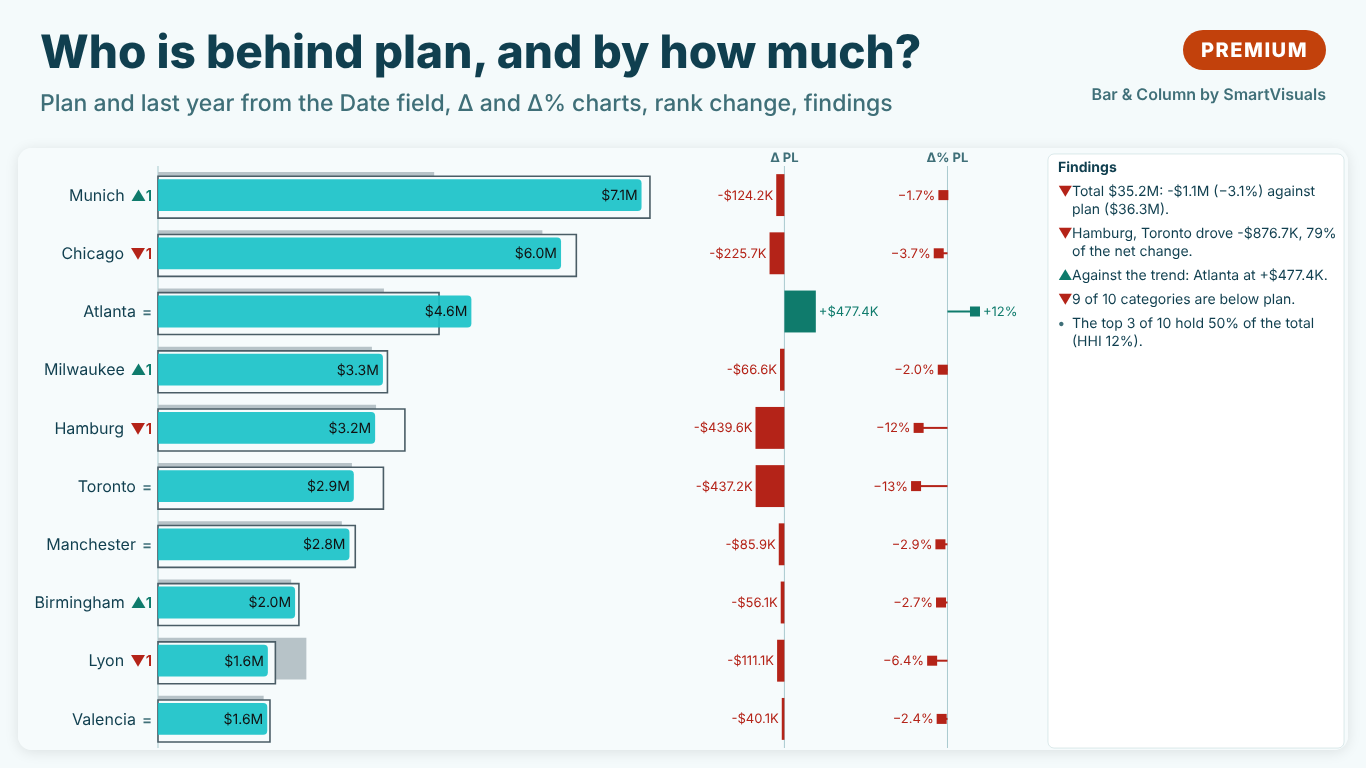
One bar chart can carry all of it. Below: the data shape, the DAX for year to date against last year and plan with a cutoff that is fair to every site, variance and variance %, rank change against last year, Top N with Other, and the calendar traps that quietly make the numbers wrong.
The data shape
A typical model for the Helios Manufacturing sites:
- a sales fact table:
Sales[OrderDate],Sales[Site],Sales[ProductLine],Sales[Amount] - a plan table at month grain:
Plan[Month](the first day of each month),Plan[Site],Plan[Amount] - a marked date table
'Date'related toSales[OrderDate]andPlan[Month] - a
'Site'dimension (Chicago, Milwaukee, Atlanta, Toronto, Manchester, Hamburg, Lyon, Valencia) related to both fact tables
The category axis comes from the dimension, never from a fact table. A site with plan but no sales yet, or with last year's sales but none this year, only appears if the axis is the dimension.
Year to date with one cutoff for everyone
TOTALYTD runs to the last date in the current filter context. On a bar chart by site with no date filter, that is the last date of the date table, often 31 December of the current year. Last year's year to date then becomes the whole of last year, and every site looks behind.
Fix the cutoff once, at the last date with sales anywhere, so a site with a quiet last week is not cut short:
Last Actual Date =
CALCULATE ( MAX ( Sales[OrderDate] ), REMOVEFILTERS () )

Revenue = SUM ( Sales[Amount] )

Revenue YTD =
VAR LastDate = [Last Actual Date]
RETURN
    CALCULATE (
        [Revenue],
        DATESBETWEEN ( 'Date'[Date], DATE ( YEAR ( LastDate ), 1, 1 ), LastDate )
    )

Revenue PY YTD =
VAR LastDate = [Last Actual Date]
RETURN
    CALCULATE (
        [Revenue],
        DATEADD (
            DATESBETWEEN ( 'Date'[Date], DATE ( YEAR ( LastDate ), 1, 1 ), LastDate ),
            -1, YEAR
        )
    )

Plan YTD =
VAR LastDate = [Last Actual Date]
RETURN
    CALCULATE (
        SUM ( Plan[Amount] ),
        DATESBETWEEN ( 'Date'[Date], DATE ( YEAR ( LastDate ), 1, 1 ), LastDate )
    )
DATEADD is used for last year on purpose. Shifting the end date with EDATE turns 28 February 2026 into 28 February 2025, which is right; but when the year before is a leap year, 28 February 2025 becomes 28 February 2024 and the 29th is lost. DATEADD follows the month-end rule: a window that ends on the last day of February covers the whole of February a year earlier.
The plan is at month grain, related through the first day of the month, so the plan of the current month counts in full from the first day. If the cutoff is the 14th, actuals hold half a month and the plan a full one. Either prorate the plan by days elapsed, or end the window at the last closed month: replace LastDate with EOMONTH ( LastDate, -1 ) when the month is not over.
Variance and variance %
Δ PL = [Revenue YTD] - [Plan YTD]

Δ% PL = DIVIDE ( [Revenue YTD] - [Plan YTD], ABS ( [Plan YTD] ) )

Δ PY = [Revenue YTD] - [Revenue PY YTD]

Δ% PY = DIVIDE ( [Revenue YTD] - [Revenue PY YTD], ABS ( [Revenue PY YTD] ) )
DIVIDE returns blank, not an error, when a site has no plan or no last year, and ABS keeps the sign meaningful when the base is negative. A site with no plan should show no variance, not a variance as large as its revenue; never wrap the plan in + 0 or COALESCE ( …, 0 ) for a chart.
For costs, below plan is good. Whatever colours the variance (conditional formatting, a status measure, the visual itself) has to flip for cost lines, or a saving shows in red.
Rank change against last year
A bar sorted by value already shows who leads. What it hides is movement: a site that climbed from sixth to third sits in the middle of the chart and looks ordinary. Rank both years and subtract:
Rank AC =
IF (
    NOT ISBLANK ( [Revenue YTD] ),
    RANKX ( ALLSELECTED ( Site[Site] ), [Revenue YTD], , DESC, SKIP )
)

Rank PY =
IF (
    NOT ISBLANK ( [Revenue PY YTD] ),
    RANKX (
        FILTER ( ALLSELECTED ( Site[Site] ), NOT ISBLANK ( [Revenue PY YTD] ) ),
        [Revenue PY YTD], , DESC, SKIP
    )
)

Rank Change =
IF ( NOT ISBLANK ( [Rank PY] ), [Rank PY] - [Rank AC] )
Positive means the site moved up. SKIP gives competition ranks (1, 2, 2, 4), the same as "min" ranking in pandas or scipy, so a tie never hides a place. The FILTER matters: without it, sites that did not exist last year enter the previous-year ranking as blanks at the bottom and push nothing, but they still count, and the numbers stop matching a hand check. A site with no previous-year value is "new", not "up by eight".
Rank before any Top N. If the chart shows the top eight, a site that fell from fifth to eleventh drops out of the chart, and its fall is exactly the finding.
Top N with Other
"The eight largest sites, and the rest as one bar" needs an axis that has an Other row, which the site dimension does not have. The usual pattern is a disconnected calculated table and a measure:
Site Axis =
UNION ( VALUES ( Site[Site] ), ROW ( "Site", "Other" ) )

Revenue Top 8 =
VAR Item = SELECTEDVALUE ( 'Site Axis'[Site] )
VAR Top8 = TOPN ( 8, ALLSELECTED ( Site[Site] ), [Revenue YTD], DESC )
RETURN
    IF (
        Item = "Other",
        CALCULATE ( [Revenue YTD], EXCEPT ( ALLSELECTED ( Site[Site] ), Top8 ) ),
        IF ( Item IN Top8, CALCULATE ( [Revenue YTD], TREATAS ( { Item }, Site[Site] ) ) )
    )
Every other measure on the chart (plan, last year, variance) needs the same treatment, sort order needs a separate column so Other stays last, and nothing tells the reader which sites Other holds. It works; it is also the part of the model nobody wants to maintain.
How to draw it
Three conventions keep a dense chart readable:
- Last year behind, plan as an outline. A grey bar behind each actual for last year and an outlined bar for the plan let the reader compare three numbers per site without three bars side by side. This is the IBCS scenario notation: actual solid, previous year grey, plan outlined, forecast hatched.
- Variance as its own small chart. Put Δ bars and Δ% pins next to the main bars, sharing the site axis, with a zero line. A variance is easier to judge as a bar from zero than as the gap between two bar ends.
- Sort by what the meeting asks. Largest first answers "who matters"; sort by variance answers "who is behind". Changing the sort should never change which sites are shown.
Calendar traps in a monthly review
- Year to date that runs to December. Without a fixed cutoff, last year's YTD is a full year. Check the PY YTD total against last year's figure for the same months by hand once.
- 29 February. Shift windows with
DATEADD, notEDATE, so February is whole in both years. - Partial months against full-month plans. Prorate, or end at the last closed month.
- A slicer on this year. A year slicer filters the date table, and last year disappears with it. Use measures that shift the window themselves, and keep the slicer off the comparison visual or use a relative date filter.
- Lost sites. A site that stopped selling still has last year's value. Keep it on the axis: a lost customer is a finding, not a blank row.
Doing it with SmartVisuals Bar & Column
SmartVisuals Bar & Column builds this chart from fields. Put Site in Category, the order date in Date (previous year), Revenue in Values and Plan in Plan / budget, and turn on Comparison & variance > Compare (premium) with Period of the Date field set to Year to date. The visual sums this year to date and the same days a year earlier with the month-end rule above, draws last year grey behind each site and the plan outlined, adds Δ and Δ% charts on the same axis, and Category axis > Rank change vs previous year puts ▲3, ▼1 or new next to each site. Lower is better (costs) flips the colours for cost lines, and the findings panel names the sites that drove most of the change, each with how it was calculated.
Top N with Other is free and needs no helper table: Top N > Show Top N only keeps the largest sites and folds the rest into Other, whose tooltip lists what it holds. So are the bar layouts (stacked, 100 %, lollipop, population pyramid), targets, the Pareto line and small multiples. The comparison layer and clustered-and-stacked in one chart are Premium at $1.99 per user per month or $19 per user per year, and every Premium feature previews in full while you edit. The visual has been submitted to Microsoft Marketplace and is not published yet; the product page will link to the listing once it is live. Everything is computed inside the report, with no external calls.
Try AI Chatbot for Free
Experience the power of conversational analytics in your Power BI reports. Get your free license in seconds - no credit card required.
Get Free License