Bar & Column

    Bars that sort themselves, variance that reads like a finance review.

    Bar chart, column chart, lollipop and population pyramid, with Top N + Other, small multiples, segment sorting, targets and analytics lines free. Premium adds actual against last year, plan and forecast with Δ and Δ% charts, rank change and findings.

    Read the documentationComing soon to Microsoft Marketplace
    Datasheet
    Status
    Coming soon to Microsoft Marketplace
    Price
    $1.99 /user/mo · $19 /user/yr
    Licensing
    Per user, assigned in the Microsoft 365 admin center, with a 30-day free trial. Unlicensed viewers see the free tier, never a blocked visual.
    Data
    Computed inside Power BI. No external calls, no API keys, no telemetry.
    Visuals API
    5.11
    Layouts
    Clustered, stacked, 100 % stacked, overlapped (lipstick), lollipop, dumbbell, population pyramid; bars or columns; clustered and stacked (Premium)
    Accessibility
    Keyboard navigation of every bar (one tab stop), live region, hidden data table, high contrast with outlines and patterns, non-colour series patterns, focus outline, minimum text size, reduce motion
    Languages
    20 languages: Chinese (simplified and traditional), Czech, Danish, Dutch, English, French, German, Hungarian, Italian, Japanese, Korean, Norwegian, Polish, Portuguese (Brazil and Portugal), Slovak, Spanish, Swedish and Turkish
    Data volume
    Up to 150,000 rows; up to 60 legend values
    Statistics
    Computed inside the visual, golden-tested against numpy, scipy and pandas
    Privacy
    No external calls, no telemetry, no privileges
    Works in
    Power BI Desktop, Service, Embedded
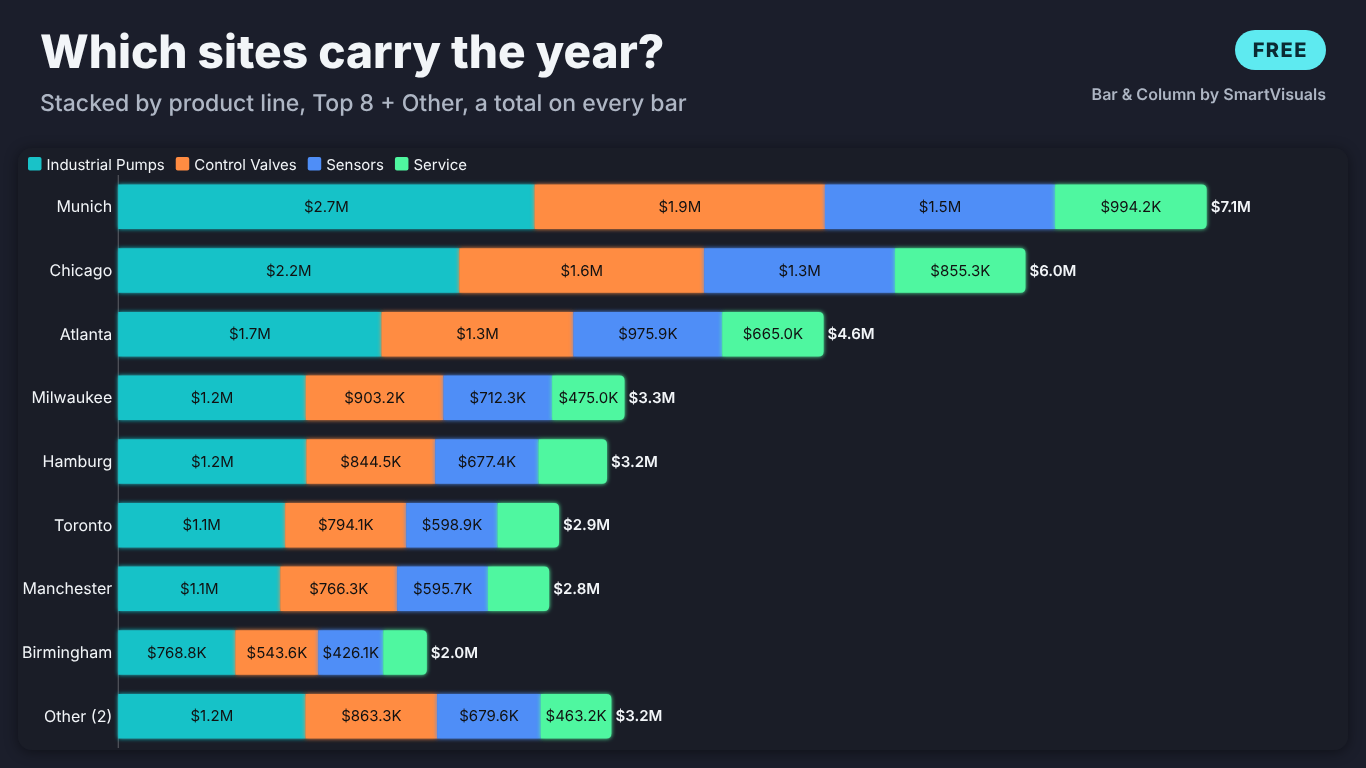
    Dark-theme stacked bar chart of revenue by site in Power BI, split into Industrial Pumps, Control Valves, Sensors and Service, the top eight sites plus Other (2) with a total at the end of every bar
    Pl. XLIII  ·  Bar & Column  ·  Free: revenue by site stacked by product line, Top 8 + Other, a total on every bar.rendered from the shipped visual
    What it does

    SmartVisuals Bar & Column is a bar chart, column chart, lollipop chart and population pyramid in one Power BI visual. Drop a field on Category and a measure on Values: bars sort themselves, labels place themselves, and one sentence under the title says what leads. An empty visual opens on a setup guide that says what to drop where.

    The free version has every bar layout, Top N + Other, small multiples, sorting by a legend segment, value and % labels, targets, error bars, reference lines, a trend line, a Pareto line, templates, four themes, keyboard navigation and 20 languages. Premium is Comparison & variance: actual against previous year (derived from your date), plan and forecast as IBCS ghost bars, Δ and Δ% charts, rank change, a findings panel and clustered and stacked in one chart. Every Premium feature previews in full while you edit, readers without a licence always see the free chart, and the visual makes no external calls.

    Free and premium

    Where the line is, exactly.

    Report authors see the full premium set in edit mode, so you can evaluate every feature on your own data before assigning a single licence. Unlicensed viewers always get a working chart.

    Free tierevery viewer
    • Every bar layoutClustered, stacked, 100 % stacked and overlapped (lipstick), as bars or columns; dates become columns on their own.
    • Lollipop, dumbbell and pyramidLollipops with data point markers, dumbbells, pill shapes and a back-to-back population pyramid.
    • Top N + OtherKeep the largest or smallest categories and fold the rest into Other; hover Other to see what it holds.
    • Small multiplesOne panel per value with a shared or own value axis and the same category order in every panel.
    • Sorting that needs no DAXBy value, name, data order or one legend segment; stacking order; a button that lets readers re-sort.
    • Labels in your model's formatValue, % of category, both, or % of total; stack totals; change % to the previous bar; label backgrounds.
    • TargetsA tick, dot or line per bar from a Target measure, target labels and the shortfall hatched.
    • Analytics linesThree reference lines and a band, a linear trend with R², a Pareto line with the 80 % point, error bars and an axis break.
    • Difference highlight and Total barA bracket between any two bars with change, per cent and CAGR for dates; a Total bar; a logarithmic axis.
    • Colour rules with a legendPower BI fx colours, plus our own rules (above or below a value, highest and lowest, dim the rest) that also work with a legend.
    • InteractionPan and zoom for long lists, drill down and expanded levels, highlight, cross-filter, report page tooltips, dynamic format strings, on-object formatting.
    • Templates and themesExecutive, IBCS, Minimal, Presentation and Print in one click, style as JSON, and four themes: SmartVisuals, Dark, Clean and Slate.
    • Accessibility and 20 languagesKeyboard navigation of every bar, screen-reader summary and data table, high contrast, patterns, reduce motion, in 20 languages.
    Premium$1.99 /user/mo · first month free
    • Previous year from your dateYear to date, latest year, quarter or month against the same days a year earlier, from a Date field, a date axis or your own measure.
    • Plan and forecast as IBCS barsPrevious year grey behind, plan outlined, forecast hatched; overlapping, beside or as markers; per legend segment too.
    • Δ and Δ% variance chartsVariance bars and pins on the same axis, two comparisons at once, met or missed colours, lower is better for costs.
    • Rank change▲3, ▼1 or new next to each category, ranked before Top N so a site that fell out of the chart still counts.
    • Findings panelTotal change, the drivers of it, how many are below plan, concentration, outliers and the biggest movers, each with how it was calculated.
    • Clustered and stackedOne stack per measure side by side, such as actual and plan each split by product line; sort by variance.
    Getting started

    From empty canvas to first chart.

    1. 01

      Add SmartVisuals Bar & Column to the page. With no fields bound it shows a setup guide that ticks off what is bound.

    2. 02

      Drag a field such as Site to Category and a measure such as Revenue to Values. A date in Category draws columns in time order; anything else draws bars sorted largest first.

    3. 03

      Add Product line to Legend and pick a layout under Layout > Chart type: stacked, 100 %, lollipop, dumbbell or population pyramid.

    4. 04

      Turn on Top N > Show Top N only, labels under Data labels, and a target, reference lines, a trend or a Pareto line from the Target card and the Analytics pane. Style template applies a finished look in one click.

    5. 05

      Optional, Premium: bind your date to Date (previous year) and Plan to Plan / budget, then turn on Comparison & variance > Compare (premium). Everything previews in full while you edit.

    Get Bar & Column

    On its way.

    Installation instructions for both paths are on the download page.

    Microsoft Marketplace (recommended)

    The offer is prepared for Microsoft Marketplace and not published yet. This page will link to the listing the moment it is live.

    Coming soon
    Documentation

    Everything else about Bar & Column.

    The guide, use cases, questions and the full settings reference. Open what you need, or search.

    Search all visuals

    Bar & Column in Power BI, explained

    6 short chapters: what the visual does and why

    Which bar and column layouts does it draw, and which are free?

    All of them are free: clustered, stacked, 100 % stacked and overlapped (lipstick) bars or columns, a lollipop with data point markers, a dumbbell and a back-to-back population pyramid, set under Layout > Chart type. Orientation is automatic: a date in Category draws columns in time order, categories draw bars sorted largest first, and Layout > Orientation overrides it. Bar shape can be square, rounded or a pill, and only the outer end of a stack is rounded.

    Top N > Show Top N only keeps the largest (or smallest) categories and folds the rest into one Other bar, placed last, whose tooltip lists what it holds. Small multiples draws one panel per value with a shared or own value axis and the same category order in every panel. The one layout that is Premium is Clustered and stacked, one stack per measure side by side, for actual and plan each split by product line.


    How do I sort by one legend segment, and let readers re-sort?

    Sorting > Sort by offers Automatic (dates in time order, else largest first), value up or down, name A to Z or Z to A, data order (the visual header's own sort) and A legend segment: type the segment's name, such as Industrial Pumps, in Segment to sort by and the sites are ordered by that product line, not by the stack total. Stacking order puts the largest or the smallest segment at the base.

    Sorting > Let readers change the sort adds a small button that cycles largest first, smallest first, A to Z and data order in reading view, so a reader can re-sort without edit rights. Small multiples share one order computed on the totals, so a site sits in the same place in every panel.

    Labels, targets and analytics lines without DAX

    Data labels show the value, the % of category, both in one label or the % of total, with Total labels on stacks and Change % to the previous bar. A label goes inside the bar when it fits and outside when not, never into a neighbour's lane; one that fits nowhere is hidden instead of overlapping. Label background puts a plate behind each label with the text contrast kept at 4.5:1.

    Bind a measure to Target and every bar gets a tick, a dot or a line through the bars, with Target labels and Mark bars below target hatching the shortfall. The Analytics pane adds up to three reference lines (a value, average, median, percentile, minimum or maximum) and a band, a linear trend with slope and R², and a Pareto line that marks where 80 % is reached. Difference highlight draws a bracket between any two bars with the change, the per cent and, for dates, the CAGR. Error bars, annotations, icons per category, a Total bar, a logarithmic value axis and an axis break for an outsized bar are free too.

    How do I compare actual with last year, plan and forecast? (premium)

    Comparison & variance is the Premium layer. Previous year can come from your own measure in Previous year, from a date column in Date (previous year), where the visual sums the current window (Year to date, Latest full year, Latest quarter or Latest month) and the same days a year earlier, or from a date Category, where it reads the bar one year back. Plan / budget and Forecast take a measure each. Comparison shown as draws them as IBCS ghost bars (previous year grey behind, plan outlined, forecast hatched), overlapping bars, bars beside or markers, also per legend segment in clustered layouts.

    Variance charts adds Δ bars and Δ% pins on the same category axis, to the right of bars or above columns, with Second variance chart for two comparisons at once. Colour bars by met / missed and Lower is better (costs) colour the result; Category axis > Rank change vs previous year puts ▲3, ▼1 or new next to each category; Sort by > Variance to comparison sorts by the gap; and Narrative > Findings panel (premium) states the total change, the categories that drove it, how many are below plan, concentration, outliers and the biggest movers, each with how it was calculated.

    What does it do with dates, blanks and leap years?

    The previous-year window follows calendar-day arithmetic: 29 February maps to 28 February, and a window that ends on the last day of February covers the whole February a year earlier, the same month-end rule as DAX DATEADD. The anchor is the latest date in the data, so every category is cut at the same day. A category with a previous-year value and no actual is kept, because a lost customer is a finding; one with no previous-year value gets no ghost bar and ranks as new.

    Blank plus blank stays blank, never zero, and a variance % against a blank or zero base is left empty rather than shown as infinite. Layout > Hide zero and blank categories removes empty categories when you want them gone. Ranks, Other, totals and every statistic are computed the same way for free and Premium users; the numbers are golden-tested against numpy, scipy and pandas.

    What do report readers without a licence see?

    Always a working chart. The visual never blocks a report and never adds a watermark. A reader without a licence sees the free chart of the same data: the bars without the comparison, Clustered and stacked shown as clustered (so no bar ever adds the plan to the actual) and Sort by variance shown sorted by value, and Power BI shows its own short licence note once. Defaults are free-only, so an unconfigured visual never raises that note.


    In edit mode every Premium feature renders in full, so you can build the review page on your own data before buying. Premium is $1.99 per user per month or $19 per user per year through Microsoft Marketplace, with the first month free, assigned per user in the Microsoft 365 admin center.

    Use cases

    Where Bar & Column earns its place

    Revenue by site, stacked by product line

    Sales operations puts Site in Category, Product line (Industrial Pumps, Control Valves, Sensors, Service) in Legend and Revenue in Values, with Layout > Chart type set to Stacked. Top N > Show Top N only keeps the eight largest sites and folds the rest into Other, whose tooltip lists what it holds, and Data labels > Total labels on stacks puts the site total at the end of every bar.

    Year to date against last year and plan (Premium)

    Finance puts Site in Category, the order date column in Date (previous year), Revenue in Values and Plan in Plan / budget, then turns on Comparison & variance > Compare (premium) with Period of the Date field set to Year to date. The visual sums this year to date and the same days a year earlier, draws last year as a grey bar behind each site and the plan as an outline, and adds Δ and Δ% charts on the same site axis. Category axis > Rank change vs previous year shows how many places each site moved.

    Where 80 % of revenue comes from

    A sales lead sets Chart type to Lollipop, turns on Pareto line > Show cumulative % line with Mark the 80 % point, adds a median under Reference lines and Colour rules > Highlight the highest bar. The chart names the site where the cumulative share passes 80 %, with no running-total measure in the model.

    A workforce pyramid for succession planning

    HR puts Age band in Category, Gender in Legend and Headcount in Values, and sets Chart type to Population pyramid (back to back). The two series are mirrored around the age labels, the oldest band sits on top, and the bands that retire in the next ten years stand out without a single calculated column.

    Defect rates with confidence bounds

    Quality puts Plant in Category, Defect rate in Values and the lower and upper bounds in Error bar: lower and Error bar: upper. Error bars > Fields are switches between bounds and distances below and above, so the bounds can come from the model as they are.

    Actual and plan, each stacked by product line (Premium)

    Put Actual and Plan in Values and Product line in Legend, and set Chart type to Clustered and stacked. Every site gets one stack for the actual and one for the plan, side by side, each split by product line, so the reader compares totals and mix in one chart.

    Questions

    12 questions asked before you did

    More questions? Write to us.

    Every bar layout is free, with Top N + Other, small multiples, segment sorting, labels, targets, error bars, analytics lines, templates, themes, accessibility and 20 languages. Premium is Comparison & variance (previous year, plan and forecast, Δ and Δ% charts, rank change, findings) and clustered and stacked in one chart, for $1.99 per user per month or $19 per user per year through Microsoft Marketplace, with the first month free.

    SmartVisuals Bar & Column has been submitted to Microsoft Marketplace and is not published yet. This page will link to the listing once it is live.

    The free chart of the same data, never a blocked or watermarked visual. Comparisons, the variance charts and the findings panel are left out, clustered and stacked is shown as clustered, and Power BI shows its own short licence note once. In edit mode every Premium feature renders in full.

    From your own measure in Previous year, from a date column in Date (previous year), where the visual sums the chosen window (year to date, latest year, quarter or month) and the same days a year earlier, or from a date in Category, where it reads the bar one calendar year back. With a date axis the year before must be in the data, so a slicer on this year hides it; the Date (previous year) field reads it itself.

    Yes. Bind both, choose which one Variance against uses for the first Δ chart, and turn on Second variance chart for the other. Previous year is drawn grey behind each bar and the plan as an outline, in IBCS notation.

    Yes, with Premium: put two or more measures in Values and a field in Legend, and set Layout > Chart type to Clustered and stacked. Each measure gets its own stack, split by the legend, side by side.

    Power BI's fx colours are offered only without a Legend. The Colour rules card works with one: highlight the highest or lowest bar, colour values above or below a threshold, and dim the bars no rule matches.

    Category and Values. Optional: Legend, Small multiples, Target, Error bar: lower and upper, Annotation (a text measure drawn on its bar), Icon or image (an emoji, short text or inline data:image), Tooltips, and for Premium comparisons Date (previous year), Previous year, Plan / budget and Forecast.

    No. The visual declares no privileges, makes no external calls and sends no telemetry. Image URLs from the web are ignored for the same reason; only inline images are drawn. The licence is checked through Power BI's own licensing service.

    Up to 150,000 rows, read in windows of 30,000; above that a warning icon says only part of the data is shown. Up to 60 legend values are drawn. When the bars no longer fit at the minimum thickness, a navigator appears and the chart pans and zooms.

    Yes. The chart is one tab stop: arrow keys walk the bars (Up and Down switch series in clustered layouts), Home and End jump to the ends, Enter or Space selects (Ctrl adds), Escape clears, and [ ] + - pan and zoom a long chart. Screen readers hear a summary sentence, each bar as it is focused, and can read a hidden table of every value.

    Post it on the public board at smartvisuals.io/feedback, where other users can vote and comment, or use the Report a bug block on the support page (smartvisuals.io/support) or email hello@smartvisuals.io. A screenshot and the fields you bound help most.

    Troubleshooting

    When it does not look right

    Found a bug or missing something? Post it on the requests board; the developer answers within two business days.

    The visual only shows a setup guide.
    Category and Values are both needed. The guide ticks off what is already bound and says what to drop where; the chart draws as soon as both fields are in.
    Previous year is missing from the comparison.
    Previous year comes from your own measure in Previous year, from a date column in Date (previous year), or from a date Category. With a date axis the year before must be in the data, so a slicer on this year hides it; bind the date to Date (previous year) instead, which reads the earlier window itself. A category with no previous-year value gets no ghost bar and ranks as new.
    My readers do not see the comparison, the Δ charts or the findings.
    Comparison & variance, the findings panel and Clustered and stacked are Premium. In edit mode they render in full; in reading view a reader without a licence sees the free chart of the same data and Power BI shows its own short licence note once. Clustered and stacked falls back to clustered, so no bar ever adds the plan to the actual. Assign the reader a licence in the Microsoft 365 admin center.
    The population pyramid says it needs two series.
    A pyramid mirrors two series: use two measures in Values, or one measure and a Legend with two values such as Female and Male. Any further series are left out.
    Sorting by a legend segment does nothing.
    With Sorting > Sort by set to A legend segment, type the legend value or measure name in Segment to sort by exactly as the legend shows it (case does not matter).
    Some categories are missing.
    Check Top N > Show Top N only and Layout > Hide zero and blank categories. When there are more bars than fit at Minimum bar thickness, the chart scrolls: use the navigator under it, the mouse wheel, or the [ and ] keys.
    Data labels disappear.
    Labels that do not fit inside a bar or in their own lane are hidden rather than drawn over a neighbour. Make the visual larger or lower Data labels > Text size; segments below Hide segment labels below (% of category) stay unlabelled on purpose.
    Data colours (fx) is not in the format pane.
    Power BI offers fx colours only when no Legend is bound. With a Legend, use the Colour rules card (above or below a value, highest and lowest, dim the rest), which works with one.
    An image in Icon or image does not show.
    Only an emoji, a short text or an inline data:image/...;base64 value is drawn. Web addresses are ignored on purpose: the visual makes no external calls.
    A warning icon says only part of the data is shown.
    The visual reads up to 150,000 rows. Above that, filter the page or use Top N so the chart draws every category you need.

    Accessibility

    Keyboard, screen readers and high contrast
    Tab
    Moves into the chart, which is one tab stop; focus starts on the first bar.
    Left / Right arrow
    Moves to the previous or next bar.
    Up / Down arrow
    Moves between bars; in clustered layouts, switches to the same category of the previous or next series.
    Home / End
    Jumps to the first or the last bar.
    Page Up / Page Down
    Jumps ten bars back or forward.
    Enter or Space
    Selects the focused bar and cross-filters the page. Hold Ctrl to add it to the selection.
    Esc
    Clears the selection.
    [ and ]
    Pans a long chart that scrolls; + and - zoom in and out.
    • Screen readers

      The chart's accessible name is its one-line caption, the sentence that says what leads. A polite live region announces each bar as it gets focus, and a visually hidden data table lists every category with its value for each series (up to 500 rows).

    • Not colour alone

      Accessibility > Distinguish series without colour gives every series its own pattern. In Premium comparisons, met and missed variance carry ▲ and ▼ and hatching as well as green and red, and the target shortfall is hatched rather than only tinted.

    • High contrast

      In Windows high contrast mode the visual uses the system's foreground, background and selection colours, draws bars as outlines with patterns, and switches Distinguish series without colour on.

    • Reduced motion

      Accessibility > Reduce motion, or the operating system's reduced-motion setting, turns off the grow animation.

    • Focus outline and text size

      Accessibility > Focus outline colour and Focus outline width (1 to 6 px, 2.5 by default) set the ring around the focused bar, and Minimum text size (6 to 16) keeps every label, axis and caption at or above that size.

    • Small tiles

      The layout drops detail in a fixed order as the visual shrinks (caption, findings, sort button, legend, axis titles, value axis, data labels) and truncates category labels last, with the full name in the tooltip, so no text is clipped.

    • Context menu

      Right-clicking a bar opens the Power BI context menu for it; right-clicking anywhere else opens it for the visual.

    • Languages

      The format pane and every text inside the chart (setup guide, tooltips, caption, findings) are available in 20 languages: Chinese (simplified and traditional), Czech, Danish, Dutch, English, French, German, Hungarian, Italian, Japanese, Korean, Norwegian, Polish, Portuguese (Brazil and Portugal), Slovak, Spanish, Swedish and Turkish.

    Missing something?

    Tell us what is missing.

    A feature you need, a bug you hit, a visual that does not exist yet. Every message reaches the person who builds these visuals, and feature requests shape what ships next. We also build visuals to order.

    Also in the family