Filter customers by revenue in Power BI: the parameter-table recipe, its traps, and a range slicer that does it
"Show me only the customers with revenue between 50k and 300k." It sounds like a slicer, and it is one of the most asked Power BI questions there is, because the obvious attempt fails: drag the Revenue measure onto a slicer and Power BI refuses. A slicer filters a column, and revenue per customer is not a column. It is a measure, computed per customer in whatever context the page is in: this year, this region, this product line.
Below: the recipe everyone copies, the four places it goes wrong, and what a numeric range slicer should do so nobody has to maintain the recipe.
Why a calculated column is the wrong fix
The first idea is to make revenue a column:
Customer Revenue =
CALCULATE ( SUM ( Sales[Amount] ) )
as a calculated column on the Customer table, then slice on it. It works on the day you build it and is wrong as soon as someone touches another slicer. A calculated column is computed once, at refresh, over all the data. Pick 2026 in a year slicer and the column still holds all-time revenue, so a customer with 400k in total and 30k this year sits in the 300k-plus band. The column cannot know about the year slicer; that is exactly what a measure is for.
The parameter-table recipe
The usual answer has three parts. A disconnected table of thresholds:
Revenue Band =
GENERATESERIES ( 0, 1000000, 10000 )
A slicer on 'Revenue Band'[Value] set to Between, and a flag measure that reads the slicer's range and tests each customer's revenue against it:
Revenue = SUM ( Sales[Amount] )

Customer In Range =
VAR Lo = MIN ( 'Revenue Band'[Value] )
VAR Hi = MAX ( 'Revenue Band'[Value] )
VAR R = [Revenue]
RETURN
    IF ( NOT ISBLANK ( R ) && R >= Lo && R <= Hi, 1 )
Then every visual on the page gets a visual-level filter: Customer In Range is 1. Because the flag is a measure, it is evaluated in the current context, so a year or region slicer changes each customer's revenue and the set of customers in range with it. That part is right, and it is why the recipe has survived for years.
Where it goes wrong
1. Totals. A table of customers filtered by the flag shows the right rows, but the total line often shows all customers. At the total there is no single customer: [Revenue] is the revenue of everyone, the flag tests that one number against the range, and the total is either everything or blank. Any measure that should respect the range at a total has to iterate the customers itself:
Revenue In Range =
VAR Lo = MIN ( 'Revenue Band'[Value] )
VAR Hi = MAX ( 'Revenue Band'[Value] )
RETURN
    SUMX (
        FILTER (
            VALUES ( Customer[Customer] ),
            VAR R = [Revenue]
            RETURN NOT ISBLANK ( R ) && R >= Lo && R <= Hi
        ),
        [Revenue]
    )
and the same again for margin, order count and every other number on the page.
2. The forgotten visual. The filter lives on each visual, not on the page. The card someone adds next month does not have it, and shows company revenue under a page that claims to show 50k to 300k customers. Nothing warns you. A page-level filter cannot help, because a measure filter only works at visual level.
3. A fixed grid. GENERATESERIES ( 0, 1000000, 10000 ) decides the possible bounds in advance. A step of 10k is too coarse for small customers and too fine for large ones, and a customer who grows past the top of the series falls outside every possible range. The slicer also shows the thresholds as a bare list or a slider with no idea where the customers actually are: most of them may sit below 50k, and the reader cannot see it.
4. It is not a filter. The selection is a range on a table nobody looks at. The filter pane says Revenue Band is between two numbers; it does not say which customers are in. Drill-through and the "filters on this visual" tooltip show the flag, not the customers, and a colleague who opens the report cannot tell why Toronto's largest account is missing.
What a range slicer should do instead
The job is not "filter a measure", which Power BI cannot do. It is "work out which customers have revenue in range, in the current context, and filter the Customer column to them". A slicer can do that itself:
- Read revenue per customer in the current filter context, the same way the flag measure does.
- Keep the customers whose revenue is in range.
- Write an ordinary filter on
Customer[Customer]with that list. - Re-list the customers whenever the context changes: another slicer, a refresh, a bookmark.
Because the result is a plain filter on the Customer column, every visual on the page respects it, including the card added next month, totals are right without iterating measures, and the filter pane shows the customers that are in.
The same thinking applies to any numeric range, not only revenue per customer:
- Show the distribution behind the slider. A histogram behind the handles shows where the values are while the reader chooses. Choosing 40 to 140 for unit price means something different when 58 % of order lines sit there than when 5 % do.
- Offer ranges that mean something. Quartiles, the middle 50 %, above the median, top 10 %, without outliers (Tukey's fences). Computed the way numpy computes percentiles by default (linear interpolation between ranks), so the numbers match a check in Python.
- Say what the range keeps. "58.2 % · 2,629 of 4,514 order lines · Median €70.1" in plain words, so nobody filters away half the business without noticing.
- Leave the ends open. A handle at the maximum should write no upper bound, so orders added tomorrow above today's highest price stay in after the refresh.
- Never write an empty filter. A range that keeps nothing blanks the whole page; it should not be applied.
- Decide whether a rule stays a rule. "Top 10 %" applied as numbers today is a fixed range tomorrow. Sometimes that is what you want (the price band stays put), sometimes not (a review of the top 10 % should still be the top 10 % after next month's data).
Doing it with SmartVisuals Range Slicer
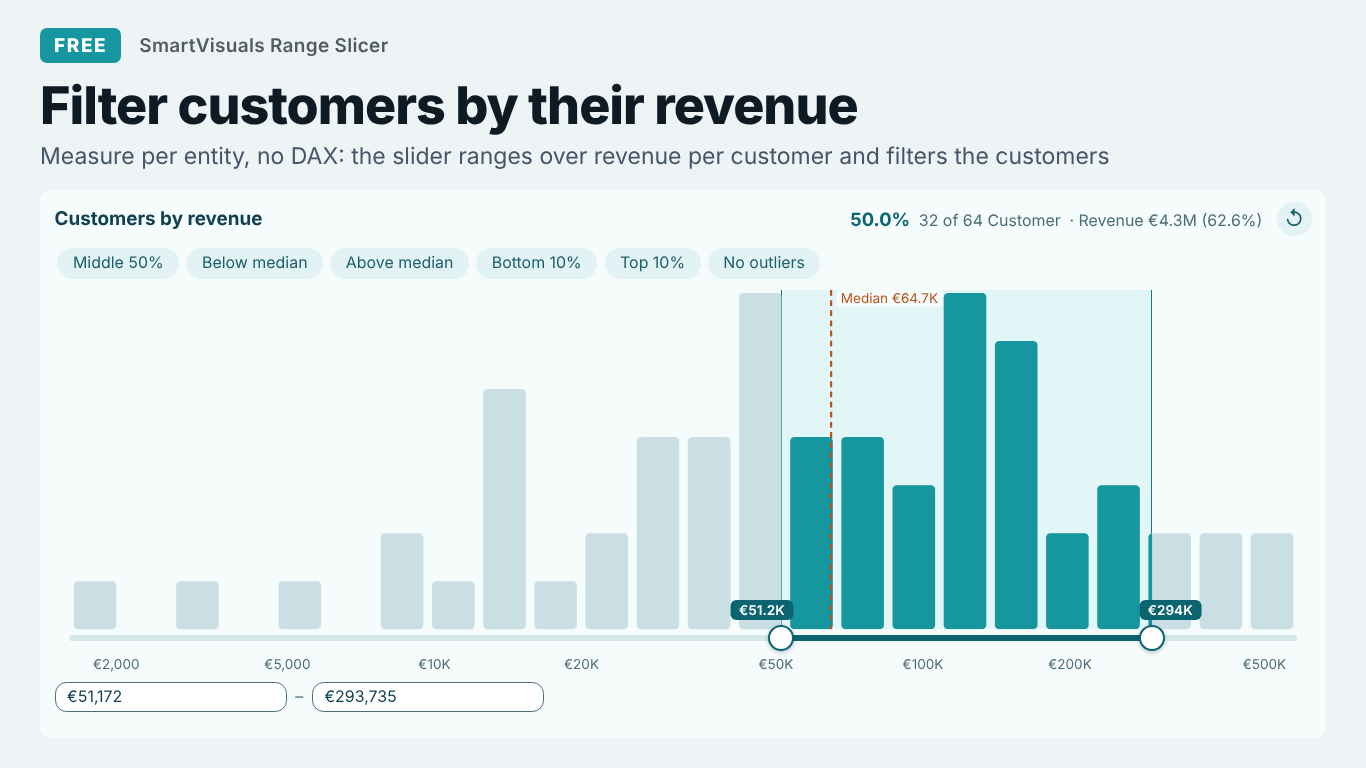
SmartVisuals Range Slicer does this in its measure-per-entity mode: put Customer in Entity (measure per entity) and Total revenue in Measure. The histogram shows how revenue is spread across customers, dragging the handles keeps the customers in range as a plain list on the Customer column, and when a year or region slicer changes their revenue the slicer re-lists the customers that are now in range. The readout says how many customers and how much revenue the range keeps, for example "50.0 % · 32 of 64 Customer · Revenue €4.3M (62.6 %)". No parameter table, no flag measure, no visual-level filters.
For a numeric column such as unit price, discount or lead time, put the column in Numeric field and a count measure in Measure, so the histogram counts rows. Presets cover quartiles, middle 50 %, above or below the median, top or bottom 10 %, without outliers and N equal groups, computed like numpy and tested against it; Slider > Open at the ends is on by default; and a selection that keeps nothing is never written. All of that is free, including measure per entity for up to 30,000 entities.
Premium ($1.99 per user per month or $19 per user per year) adds rules that stay live after a refresh or a cross-filter (P5 to P95, mean ± 1σ or 2σ, top or bottom N %, above a target), several ranges, exclude bands and named buckets your readers click, a second numeric field with a joint density, the distribution split by a segment or against last year, and the top customers the range kept and dropped. Every Premium feature works while you edit, and readers without a licence always get a working slicer with the free features. The visual has been submitted to Microsoft Marketplace and is not published yet; the product page will link to the listing once it is live. It makes no external calls.
Try AI Chatbot for Free
Experience the power of conversational analytics in your Power BI reports. Get your free license in seconds - no credit card required.
Get Free License