Range Slicer

    The range slicer that shows what the range keeps.

    The histogram sits behind the slider, quartiles and top 10% are one click, and the readout says in plain words how much you kept. Filter customers by their revenue with no DAX, free. Premium adds live rules, several ranges, named buckets and a second field.

    Read the documentationComing soon to Microsoft Marketplace
    Datasheet
    Status
    Coming soon to Microsoft Marketplace
    Price
    $1.99 /user/mo · $19 /user/yr
    Licensing
    Per user, assigned in the Microsoft 365 admin center, with a 30-day free trial. Unlicensed viewers see the free tier, never a blocked visual.
    Data
    Computed inside Power BI. No external calls, no API keys, no telemetry.
    Visuals API
    5.11
    Modes
    A numeric column, or measure per entity (an entity column plus a measure); between, at least, at most or a single value; horizontal or vertical
    Accessibility
    Keyboard sliders, ARIA slider labels, announced readout, histogram data table, high contrast, hatched out-of-range bars, focus ring, minimum text size, reduce motion
    Languages
    20 languages: Chinese (simplified and traditional), Czech, Danish, Dutch, English, French, German, Hungarian, Italian, Japanese, Korean, Norwegian, Polish, Portuguese (Brazil and Portugal), Slovak, Spanish, Swedish and Turkish
    Data volume
    Up to 150,000 rows, read in windows of 30,000; measure per entity free up to 30,000 entities
    Statistics
    Percentiles and rules computed inside the visual, golden-tested against numpy
    Privacy
    No external calls, no telemetry
    Works in
    Power BI Desktop, Service, Embedded
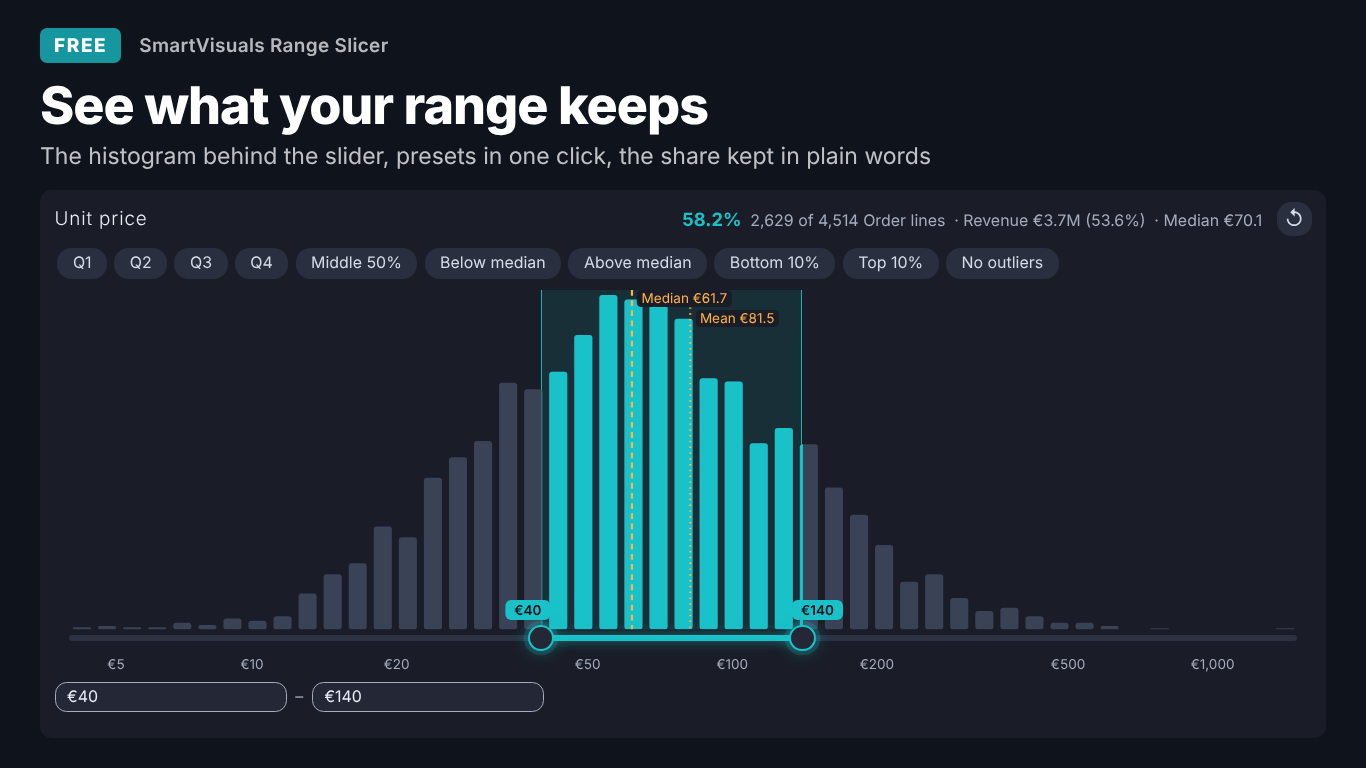
    Dark-theme numeric range slicer in Power BI on unit price with a histogram behind the slider, quartile and median presets, median and mean markers, and a readout saying 58.2% of 4,514 order lines are kept
    Pl. XLV  ·  Range Slicer  ·  Free: the histogram behind the slider, presets in one click and what the range keeps.rendered from the shipped visual
    What it does

    SmartVisuals Range Slicer is a numeric range slicer and range filter for Power BI with the distribution right behind the slider. Readers drag the handles, draw a range on the bars or type exact values, and read what the range keeps: "58.2% · 2,629 of 4,514 Order lines · Median €70.1". Presets for quartiles, the middle 50%, the median split, top and bottom 10% and no outliers are computed like numpy.

    Everything a reader needs to filter is free: the histogram, presets, typed bounds, measure per entity (customers by revenue with no DAX), default selection, bookmarks, sync slicers, templates, four themes, keyboard sliders and 20 languages. Premium, Distribution intelligence, adds rules that stay live after a refresh, several ranges, exclude bands, named buckets, a second field with a joint density, the distribution split by a segment or against last year, and the top entities kept and dropped. Every Premium feature works while you edit, readers without a licence always get a working slicer, and the visual makes no external calls.

    Free and premium

    Where the line is, exactly.

    Report authors see the full premium set in edit mode, so you can evaluate every feature on your own data before assigning a single licence. Unlicensed viewers always get a working chart.

    Free tierevery viewer
    • Histogram behind the sliderBars, a curve or dots; rounded, automatic, Freedman–Diaconis, Sturges, square-root or fixed bins; a log scale that switches on for long tails; median and mean markers.
    • Presets in one clickQuartiles, middle 50%, above or below the median or mean, top or bottom 10%, without outliers and N equal groups, computed like numpy.
    • What the range keepsThe share kept, rows kept of the total in their real name, the measure kept and its share, and the median of the kept values.
    • Measure per entityFilter customers or products by a measure, such as revenue 50k to 300k, with no DAX; re-listed when other filters change.
    • Every way to chooseDrag the handles or the window, draw on the bars, click a bar, or type "10-50" or ">200" with your locale's separators, 1.5k, 2M, % and currency.
    • Between, at least, at most or one valueHorizontal or vertical, a step setting, snapping to the step, to data values or to bin edges, and open ends after a refresh.
    • Default selection and ApplyOpen on any preset or a custom range, a Reset button, and an Apply button for heavy models.
    • Plays well with the reportBookmarks, sync slicers, cross-highlight on the bars, tooltips with up to five measures, report page tooltips, dynamic format strings.
    • On-object formatting and fxStyle the header, histogram, slider, presets, readout and inputs on the canvas; conditional formatting on the bar colours by any measure.
    • Templates and setup guideExecutive, Analyst, Minimal, Presentation, Print and Compact; an empty slicer says which field goes where.
    • Any size, four themesA full histogram, a compact slider with presets in a menu, or one line on small tiles; SmartVisuals, Dark, Clean and Slate.
    • Accessibility and 20 languagesKeyboard sliders, screen-reader labels and a histogram data table, high contrast, hatched out-of-range bars, reduced motion, in 20 languages.
    Premium$1.99 /user/mo · first month free
    • Live rulesTop 10%, mean ± 1σ or 2σ, P5 – P95, P1 – P99, top or bottom N% and above a target, re-resolved after a refresh or a cross-filter.
    • Several ranges and exclude bandsShift + drag or type "10-50; >200" for several bands at once, or exclude them instead.
    • Named buckets"Budget: <40; Standard: 40-120; Premium: 120+" as chips your readers click, one or several.
    • A second fieldA second numeric field with its own slider and a joint density: drag a rectangle to set both ranges.
    • Distribution split and comparisonThe histogram stacked by a segment, against a comparison measure such as last year, or against the data as first loaded.
    • Who was kept and droppedThe top entities the range kept and dropped, with Other, as a report page tooltip; measure per entity beyond 30,000 entities.
    Getting started

    From empty canvas to first chart.

    1. 01

      Add SmartVisuals Range Slicer to the page. With no fields bound it shows a setup guide that says which field goes where and loads a template in one click.

    2. 02

      For a number: drag the column, such as Unit price, to Numeric field and a count measure to Measure so the bars count rows. For customers by a measure: drag Customer to Entity (measure per entity) and Total revenue to Measure.

    3. 03

      Drag the handles, draw on the histogram or click a preset; the readout says what the range keeps. Add a measure to Tooltips to see how much of it the range keeps too.

    4. 04

      Set the selection type and snapping under Slider, the presets under Presets (Default selection opens the page on one), and a look under Theme and colours > Style template.

    5. 05

      Optional, Premium: turn on Distribution rules (premium) > Keep rules live, add Named buckets, or bind Second numeric field (premium), Split by (premium) or Comparison (premium). Everything works while you edit.

    Get Range Slicer

    On its way.

    Installation instructions for both paths are on the download page.

    Microsoft Marketplace (recommended)

    The offer is prepared for Microsoft Marketplace and not published yet. This page will link to the listing the moment it is live.

    Coming soon
    Documentation

    Everything else about Range Slicer.

    The guide, use cases, questions and the full settings reference. Open what you need, or search.

    Search all visuals

    Range Slicer in Power BI, explained

    6 short chapters: what the visual does and why

    How do I filter a number in Power BI and see where the data is?

    Put the column, such as Unit price, in Numeric field and a count measure, such as Count of order lines, in Measure. SmartVisuals Range Slicer draws the histogram right behind the slider, so the reader sees where the values sit while choosing. Drag a handle, drag the whole window, draw a range on the bars, click a bar for that bin, or type exact bounds; every visual on the page follows.

    The readout says in plain words what the range keeps, for example "58.2% · 2,629 of 4,514 Order lines · Revenue €3.7M (53.6%) · Median €70.1": the share kept, the rows kept of the total in their real name, the first tooltip measure kept and its share, and the median of the kept values. Without a measure each distinct value counts once, so bind one when the bars should count rows.


    Which presets are there, and how are the quartiles computed?

    One click each, free: Q1 to Q4, middle 50%, above or below the median, top or bottom 10%, without outliers (Tukey's fences), above the mean, and Equal groups (5 gives quintiles, 10 deciles). Percentiles are computed like numpy's default, linear interpolation over all the rows the Measure counts, and tested against numpy. Presets > Default selection opens the page on any of them or on a custom range.

    Free presets are applied as numbers: a top 10% chosen today stays the same range after a refresh. Distribution rules (premium) > Keep rules live turns a rule into a live one that is re-resolved whenever the data or the other filters change, and adds mean ± 1σ or 2σ, P5 – P95, P1 – P99, top or bottom N% and above a target.

    How do I filter customers by their revenue, with no DAX?

    Put Customer in Entity (measure per entity) and Total revenue in Measure. The slider then ranges over revenue per customer, and the filter keeps the customers in range as a plain list on the Customer column, so every visual on the page respects it and the filter pane shows it. When a year or region slicer changes their revenue, the slicer re-lists the customers that are now in range.

    That replaces the parameter table, flag measure and visual-level filter many reports carry. Measure per entity is free for up to 30,000 entities, one data window; beyond that, up to 150,000, is Premium. With Premium, Distribution analysis (premium) > Top entities listed names the largest customers the range kept and dropped, with Other, and What the range dropped shows them as a report page tooltip.

    Can my readers pick several ranges, buckets or two fields at once? (premium)

    Yes, with Premium. Several ranges (Shift + drag) lets a reader hold several bands at once, typed as "10-50; >200" too, Exclude mode turns the selection into bands to leave out, and Named buckets turns "Budget: <40; Standard: 40-120; Premium: 120+" into chips the reader clicks, one or several. Power BI's range filter takes two conditions, so several ranges are written as the list of values inside them and re-listed when the data changes.

    Second numeric field (premium) adds its own slider, with both ranges filtering together, and Joint density of the two fields draws a 2-D density where dragging a rectangle sets both ranges. Split by (premium) stacks the histogram by a segment in its real names, and Comparison (premium) draws a measure such as last year's count as an outline over the bars.

    What happens after a refresh, with bookmarks and with other slicers?

    Slider > Open at the ends is on by default: a handle at the minimum or maximum writes no bound there, so rows above today's highest price stay selected after tomorrow's refresh. By default the histogram and the slider's ends follow the other filters; Slider > Bounds > Fixed (widest seen) keeps them. A range that keeps no loaded value is never written, because an empty filter would blank the report.

    Bookmarks and sync slicers work, cross-highlighting from other visuals shows on the bars, and the Apply button makes heavy models wait until the reader is done. Typed bounds accept the reader's own separators, 1.5k, 2M, 12.5% and currency, and are never snapped; dragged handles snap to the step, to values in the data or to bin edges as set in Slider > Handles snap.

    What do report readers without a licence see?

    Always a working slicer with every free feature. The visual never blocks a report and never adds a watermark. Premium chips are hidden; a saved live rule keeps its numbers and stops rolling; a saved filter from the second slider stays in place and is disclosed in a note rather than silently dropped; several typed ranges apply the first one. Power BI shows its own short licence note once. Defaults are free-only, so an unconfigured slicer never raises that note.

    In edit mode every Premium feature works, and Premium presets carry a corner mark so authors know which chips their readers will not get. Premium is $1.99 per user per month or $19 per user per year through Microsoft Marketplace, with the first month free, assigned per user in the Microsoft 365 admin center.

    Use cases

    Where Range Slicer earns its place

    Price bands in a sales report

    Unit price goes to Numeric field and Count of order lines to Measure, so the histogram counts rows rather than distinct prices. Readers drag the handles to 40 to 140 or click Middle 50%, every visual on the page follows, and the readout says what the range keeps, for example "58.2% · 2,629 of 4,514 Order lines · Median €70.1". Histogram > Value scale on Auto switches to a log scale by itself for long-tailed prices.

    Customers by revenue, without a parameter table

    Customer goes to Entity (measure per entity) and Total revenue to Measure. The slider ranges over revenue per customer and the filter keeps the customers in range as a plain list on the Customer column. When a year or region slicer changes their revenue, the slicer re-lists the customers that are now in range, with no DAX and no helper table.

    Lead-time review without the outliers

    Lead time (days) goes to Numeric field, and Presets > Default selection is set to Without outliers, so the page opens on the Tukey fences of the current data. With Premium, the P5 – P95 rule and Distribution rules (premium) > Keep rules live keep the band right after every refresh and cross-filter.

    Discount policy check

    Discount (a percentage column) goes to Numeric field and Revenue to Tooltips. Typing 12.5% in the upper box and setting Slider > Selection to At most shows the share of order lines and, through the first tooltip measure, the revenue at or below that discount.

    Price tiers your readers click (Premium)

    Under Distribution rules (premium) > Named buckets the author types "Budget: <40; Standard: 40-120; Premium: 120+". The buckets become chips; a reader picks one or several, and with Split by (premium) set to Region the histogram is stacked by region in its real names.

    Quintiles in one click

    Presets > Equal groups set to 5 adds five chips, 1/5 to 5/5, each holding the same number of rows. The percentiles behind them are computed like numpy's default and tested against it.

    Questions

    12 questions asked before you did

    More questions? Write to us.

    Everything a reader needs to filter is free: the histogram, presets, typed bounds, the readout, measure per entity up to 30,000 entities, default selection, bookmarks, sync slicers, templates, themes, accessibility and 20 languages. Premium (Distribution intelligence) adds live rules, several ranges, exclude bands, named buckets, a second field, the distribution split by a segment or a comparison, and the top entities kept and dropped, for $1.99 per user per month or $19 per user per year through Microsoft Marketplace, with the first month free.

    SmartVisuals Range Slicer has been submitted to Microsoft Marketplace and is not published yet. This page will link to the listing once it is live.

    A working slicer with every free feature, and once, Power BI's own short licence note; never a block or a watermark. Premium chips are hidden, a saved live rule keeps its numbers, and a saved second-field filter stays in place with a note that says so.

    Like numpy's default percentile: linear interpolation between ranks (type 7) over all the rows the Measure counts. The presets and rules are tested against numpy.

    Yes: put a category such as Customer in Entity (measure per entity) and the measure in Measure. The filter keeps the categories whose measure is in range, as a list on that column, and is re-listed when other filters change the measure.

    Yes. By default the histogram and the slider's ends follow the other filters on the page; Slider > Bounds > Fixed (widest seen) keeps them in place.

    Slider > Open at the ends is on by default: a handle at the minimum or maximum writes no bound there, so new rows beyond today's range stay selected after a refresh. Turn it off to always write both bounds.

    A preset stored as a rule, such as P5 – P95 or the top 10%, and re-resolved whenever the data or the other filters change, so the band stays right after every refresh. Live rules are Premium; free presets are applied as the numbers they resolve to.

    Yes, both. Sync slicers need one field per slicer, so a slicer with a Second numeric field (premium) does not sync.

    No. The visual makes no external calls and sends no telemetry; every percentile, rule and readout is computed inside the visual. The licence is checked through Power BI's own licensing service.

    Yes. Every handle is a keyboard slider: arrow keys move by the step, Shift by ten steps, Page Up and Page Down by a tenth of the range, Home and End to the ends, Enter applies and Esc cancels. Screen readers hear the field, the value and what the range keeps, and get the histogram as a data table.

    Post it on the public board at smartvisuals.io/feedback, where other users can vote and comment, or use the Report a bug block on the support page (smartvisuals.io/support) or email hello@smartvisuals.io. A screenshot and the fields you bound help most.

    Troubleshooting

    When it does not look right

    Found a bug or missing something? Post it on the requests board; the developer answers within two business days.

    The visual says my field is not numeric.
    A text or date column is in Numeric field. Use a numeric column, or put the column in Entity (measure per entity) with a measure in Measure to range over the measure per entity instead.
    The bars count distinct values, not rows.

    No measure is bound, so each distinct value counts once. Add a count measure, for example COUNTROWS of the order lines table, to Measure.
    A note says it is showing the first 30,000 customers.

    Measure per entity is free for up to one data window of 30,000 entities; beyond that it is Premium (up to 150,000, fetched in segments). Readers without a licence get the first window and the note. Narrow the entities with a page filter, or assign a licence.

    My range did not apply and "keeps nothing" was announced.
    A selection that keeps no loaded value is never written, because an empty filter would blank the report. Widen the range.
    The ends of the slider changed after another slicer was used.
    By default the histogram and the slider's ends follow the other filters. Set Slider > Bounds to Fixed (widest seen) to keep them.
    A saved Top 10% no longer matches the data after a refresh.
    Free presets are applied as numbers and do not move. With Premium, Distribution rules (premium) > Keep rules live re-resolves the rule whenever the data changes, and marks its chip as live.
    A reader sees "Also filtered: … (premium field)".
    The second slider (Second numeric field (premium)) is Premium. For a reader without a licence its saved filter stays in place and is disclosed in that note rather than silently dropped. Assign a licence, or remove the second field.
    Several typed ranges applied only the first one.
    Several ranges ("10-50; >200") are Premium; a reader without a licence gets the first range and a note saying so. One typed range, such as "10-50" or ">200", is free.
    Sync slicers do not sync this slicer.
    Power BI syncs slicers that filter a single field. A slicer with a Second numeric field (premium) filters two, so use one field per synced slicer.
    The handles snap and I need an exact bound.
    Handles snap as set in Slider > Handles snap (to the step, to values in the data or to bin edges). Type the value in the box instead, typed values are never snapped, or choose Free.

    Accessibility

    Keyboard, screen readers and high contrast
    Tab
    Moves to the next handle, preset chip, button or input box. Every handle is a slider of its own.
    Left / Down arrow
    Moves the focused handle down by one step (to the previous value or bin edge when the handles snap to them).
    Right / Up arrow
    Moves the focused handle up by one step.
    Shift + arrow
    Moves the handle by ten steps.
    Page Up / Page Down
    Moves the handle by a tenth of the range.
    Home / End
    Moves the handle to the start or the end of the range.
    Enter
    Applies the range at once; otherwise it is applied a moment after the last key. In an input box, applies the typed value.
    Esc
    Cancels the change; in an input box, restores the previous value.
    • Screen readers

      Each handle is an ARIA slider named after the field, with its minimum, maximum and current value read in the report's number format. The readout of what the range keeps is announced when it changes, and the histogram comes with a summary (range and quartiles) and a data table of every bin with its count, share and whether it is in range. Presets, buckets and the Keep / Exclude toggle are buttons with a pressed state.

    • Not colour alone

      Accessibility > Hatch bars out of range gives the bars outside the selection a pattern, not only a lighter colour. The Print template switches it on.

    • High contrast

      In Windows high contrast mode the visual uses the system colours only, and bars outside the range are drawn as outlines.

    • Reduced motion

      Accessibility > Reduce motion turns off the visual's transitions.

    • Focus ring and text size

      Accessibility > Focus ring colour and Focus ring width set the outline around the focused handle or button, and Minimum text size (0 = no minimum) keeps every label at or above that size.

    • Small tiles and vertical layout

      Below 240 × 150 px the slicer switches to a compact slider with the presets in a menu, and below 150 × 74 px to one line with the selection as a pill, so it stays usable on any tile. Slider > Orientation set to Vertical turns the histogram a quarter for a tall sidebar.

    • Context menu

      Right-clicking anywhere on the slicer opens the Power BI context menu for the visual.

    • Languages

      The format pane and every text on the visual (setup guide, presets, readout, tooltips, notes) are available in 20 languages: Chinese (simplified and traditional), Czech, Danish, Dutch, English, French, German, Hungarian, Italian, Japanese, Korean, Norwegian, Polish, Portuguese (Brazil and Portugal), Slovak, Spanish, Swedish and Turkish. Numbers and typed values follow the viewer's locale.

    Missing something?

    Tell us what is missing.

    A feature you need, a bug you hit, a visual that does not exist yet. Every message reaches the person who builds these visuals, and feature requests shape what ships next. We also build visuals to order.

    Also in the family