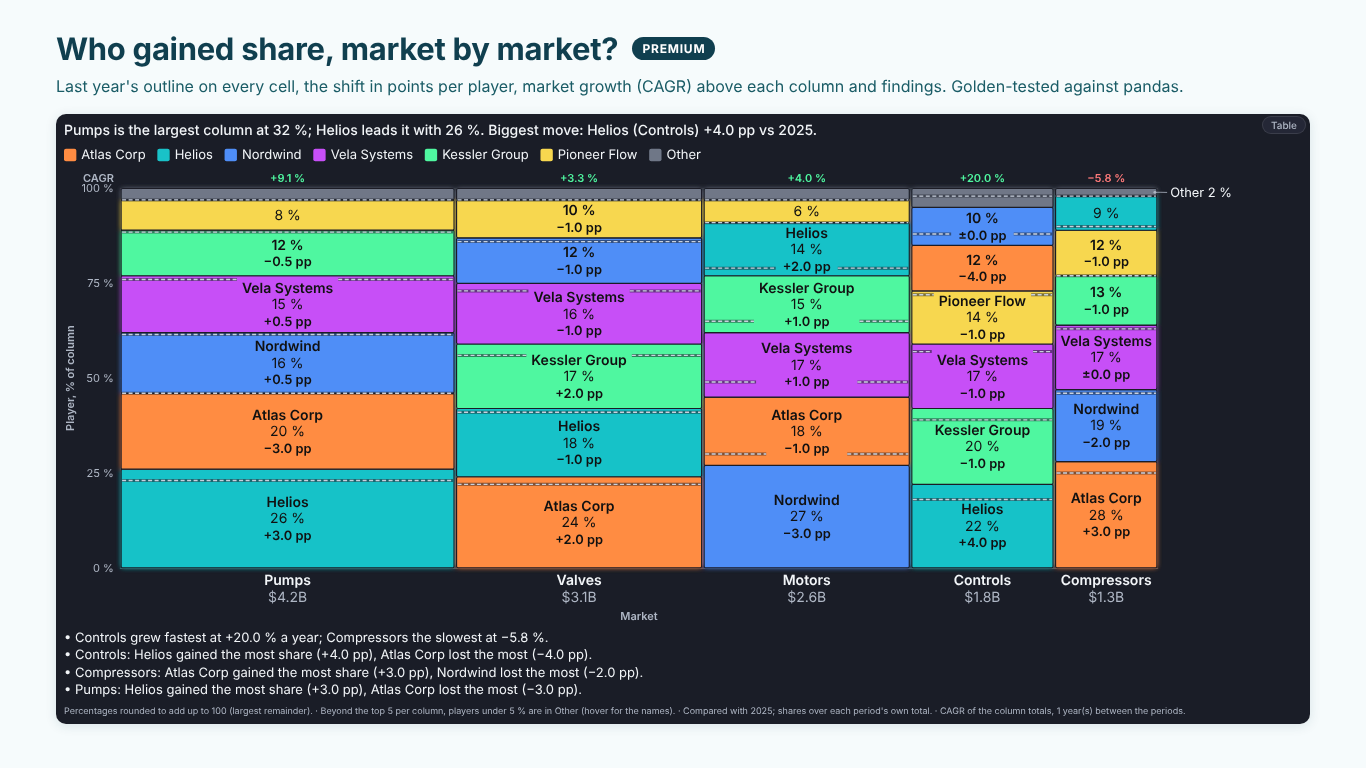
Marimekko chart in Power BI: the data shape, the Width measure and share shift
A Marimekko chart answers two questions at once: how big is each market, and who holds it? Column width is the size of the market, cell height each player's share within it, so the area of a cell is that player's revenue in that market. On one slide a strategy team sees that Pumps is the largest market, that Helios leads it with 26 %, and that the small Compressors market is held by somebody else.
That density is also why Marimekko charts go wrong easily. The widths come from the wrong measure, the long tail turns columns into stripes, and the "what changed" question ends up on a second slide. This article covers the data shape, the measures behind a market map and the comparison with last year, with an example from the fictional Helios Manufacturing strategy team.
The data: two categories and one additive measure
A Marimekko needs one row per market and player with a measure that adds up:
| Market | Player | Revenue 2026 ($M) |
|---|---|---|
| Pumps | Helios | 1,092 |
| Pumps | Atlas Corp | 840 |
| Valves | Atlas Corp | 744 |
| Valves | Helios | 558 |
Market goes on the columns, Player splits each column, and Revenue does two jobs: the column total sets the width, and each player's share of that total sets the height. In DAX, the share of the column is:
Share of Market =
DIVIDE (
    [Revenue],
    CALCULATE ( [Revenue], ALLSELECTED ( Players[Player] ) )
)
and the market's share of the whole, which is the column width:
Market Weight =
DIVIDE (
    CALCULATE ( [Revenue], ALLSELECTED ( Players[Player] ) ),
    CALCULATE ( [Revenue], ALLSELECTED ( Markets[Market] ), ALLSELECTED ( Players[Player] ) )
)
ALLSELECTED rather than ALL keeps slicers working: filter the report to Europe and the shares are shares of the European market, not of the world.
Power BI's built-in visuals have no Marimekko. The usual workaround is a 100 % stacked column chart, which shows the heights correctly but draws every column the same width, so Compressors looks as important as Pumps. That loses half of what the chart is for.
When the values cannot set the widths
The column width only works when the measure adds up across players. Revenue, units and headcount do. Average price, margin %, utilisation and satisfaction scores do not: the "total" of three average prices is meaningless, and a column built from it is as wide as a coincidence.
For those, give the width its own measure. A price map by market and supplier keeps Average Price as the value and Units as the width, so a market is as wide as its volume and the heights compare prices. The same applies to a cost curve: plants sorted by unit cost, each bar as wide as its capacity, so the area is the cost of running the plant at full load. Unit cost is the value, Capacity the width, and the chart reads like a supply curve: a demand line drawn across it shows which plant serves the last unit and sets the marginal cost.
If a chart has averages in the values and no separate width, check the widths before anyone reads it.
Fold the long tail per column
Real markets have a long tail. Pumps has five players above 5 % and a dozen below. Drawn as they are, the small ones become hairlines with no room for a label, and the eye reads the column as noise.
Group them per column, not across the chart. A player can be large in Controls and tiny in Pumps; a global Top 5 would either hide it where it matters or drag hairlines into every column. A rule that works: keep the top five players in each column and fold players under 5 % beyond them into an Other cell, and keep the names of Other's members available on hover or in a table. Label Other so the reader knows it is a bucket, not a competitor called Other.
Two smaller rules make the rest readable. Round the shares within each column so they add up to 100, with the largest-remainder method rather than rounding each one on its own (which can give 99 % or 101 %). And label a cell only where the label fits; a thin cell at the right edge can carry its label outside with a leader line instead of losing it.
Share shift in points
A market map shows this year. The review asks what changed. Compare share, not revenue: a player whose revenue grew 10 % in a market that grew 20 % lost ground. Share shift is the difference of two shares, each over its own period's total, in percentage points:
Share of Market LY =
CALCULATE ( [Share of Market], SAMEPERIODLASTYEAR ( 'Date'[Date] ) )

Share Shift (pp) =
( [Share of Market] - [Share of Market LY] ) * 100
"Helios +4.0 pp in Controls" is a sentence a strategy team understands. "Helios share +22 %" is the percentage change of a percentage, and it confuses everybody. When a player appears in one year only, its shift is its whole share, gained or lost; say so instead of showing a blank.
The market itself grows too. With two periods some years apart, the compound annual growth of each column is:
Market CAGR =
VAR Now = CALCULATE ( [Revenue], ALLSELECTED ( Players[Player] ) )
VAR Before =
    CALCULATE (
        [Revenue],
        ALLSELECTED ( Players[Player] ),
        DATEADD ( 'Date'[Date], -[Years Between], YEAR )
    )
RETURN
    IF ( Before > 0, ( Now / Before ) ^ ( 1 / [Years Between] ) - 1 )
where Years Between is the number of years between the two periods (1 for last year). On the Helios map, Controls grew fastest at 20 % a year and Compressors shrank by 5.8 %: the share Helios gained in Controls is worth more than the same points in Compressors.
Relative share and where the prize is
Two more numbers turn a market map into a strategy chart.
Relative market share is a player's share divided by the share of the largest rival in the same market. Above 1, it leads the market; 0.5 means the leader is twice its size. In DAX, the largest rival's share is the maximum over the other players:
Relative Share =
VAR Mine = [Share of Market]
VAR ThisPlayer = SELECTEDVALUE ( Players[Player] )
VAR Rival =
    MAXX (
        FILTER ( ALLSELECTED ( Players[Player] ), Players[Player] <> ThisPlayer ),
        [Share of Market]
    )
RETURN
    DIVIDE ( Mine, Rival )
Where is the prize asks how much of each market a focus player does not hold yet: the market size times one minus its share, or capped at a realistic target share. Ranked by size, it turns "we are strong in Pumps" into "the biggest open headroom is still Pumps, $3.1B, then Valves at $2.5B".
Doing it in one visual
With those measures, a Marimekko in Power BI usually takes a 100 % stacked column chart with fixed widths, a table of shifts and a card of growth rates. We built SmartVisuals Marimekko to draw the whole market map from the fields above. Market goes to Category, Player to Segment and Revenue to Values; column widths follow the column totals, or a Width measure when the values are averages, ratios or prices. 100 % or actual values, vertical columns or horizontal bars, the long tail folded into Other per column by default with its members on hover, labels outside thin cells, percentages that add up to 100, tooltips and the plain cost curve are free, with no watermark.
The market map review is premium: bind last year to Compare and every cell gets last year's boundary and its share shift in points, with segment CAGR above the columns; relative market share and a focus player kept in colour across every market; where is the prize; a target band per market; the cost-curve demand line with the marginal plant; small multiples; and findings that name the biggest movers. Premium is $1.99 per user per month or $19 per user per year; readers without a licence see the free market map, never a blank one. The visual has been prepared for Microsoft Marketplace and is not published there yet. It is also one of the views of SmartVisuals Part-to-Whole, next to pie and donut, funnel, waffle and more.
The checklist
A Marimekko holds up when:
- the values add up across players, or the widths come from their own measure;
- shares use ALLSELECTED, so slicers change the market rather than break it;
- the long tail is folded per column into a labelled Other, and shares add up to 100 in every column;
- changes are share shifts in points, each share over its own period's total;
- growth of the market sits next to the share shift, so points in a fast market count for more.
Try AI Chatbot for Free
Experience the power of conversational analytics in your Power BI reports. Get your free license in seconds - no credit card required.
Get Free License