How do I make a Marimekko chart in Power BI?
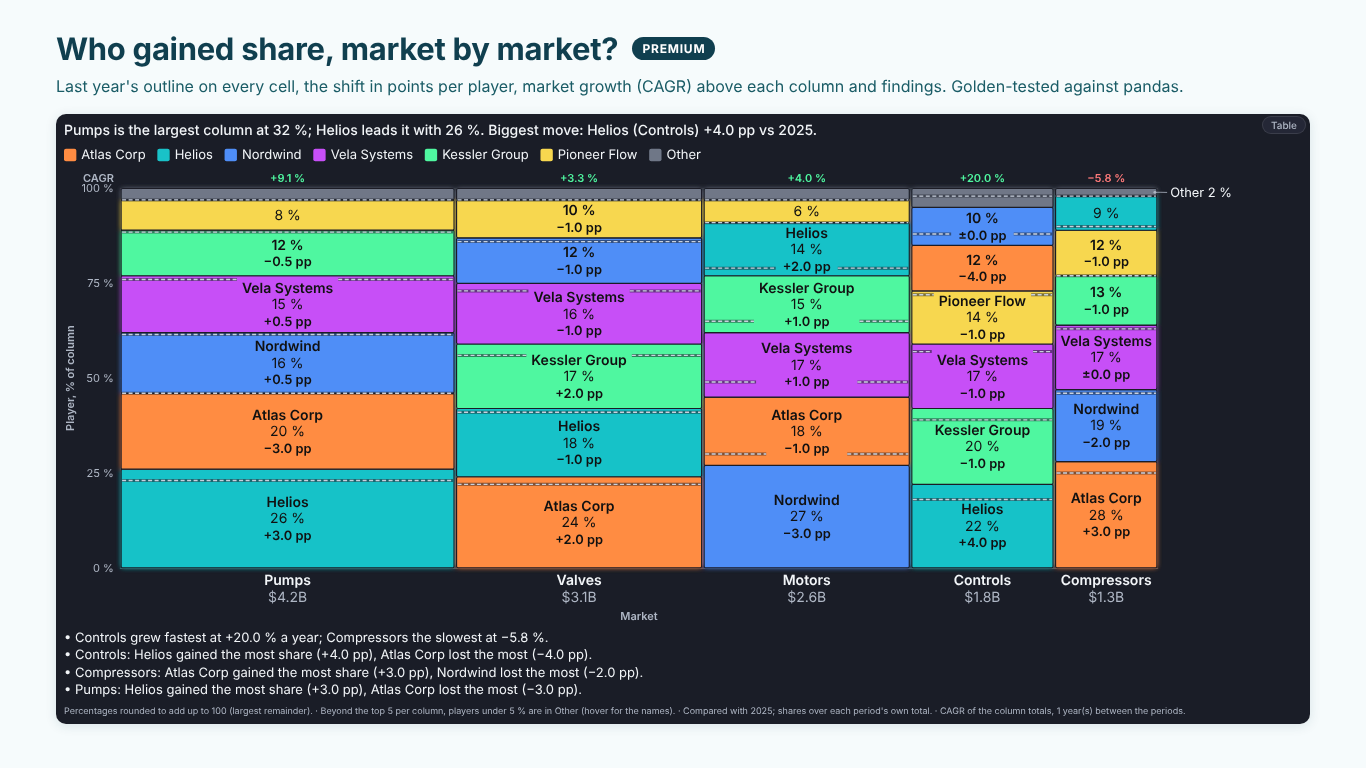
Power BI's built-in charts have no Marimekko: a 100 % stacked column chart gets the heights right but draws every column the same width, so a small market looks as important as a large one. SmartVisuals Marimekko takes Category (the columns, such as markets), Segment (the cells, such as players) and a measure in Values. Column width is each column's total, cell height each segment's share of its column, so the area of a cell is its value.
Marimekko > Chart switches between the 100 % Marimekko, Actual values (bar Mekko), where heights are the values themselves, and the cost curve. Orientation turns the columns into horizontal bars. Sort Columns and Sort Segments set the order, largest first by default, or the same segment order in every column.