Pie chart in Power BI: Top N + Other with DAX, labels that add up to 100 %, and a ring for last year
The pie chart has a bad reputation, and most of it is earned by pies with fourteen slices, unsorted, with labels that add up to 101 %. A pie with five sorted slices, a named Other and a total in the middle reads in a second. The difference is three or four decisions, and Power BI makes most of them hard.
This article takes revenue by plant for Helios Manufacturing, ten plants from Chicago to Birmingham, and goes through those decisions: how many slices, what to do with the rest, how to round, and how to show last year on the same chart.
How many slices?
The eye compares angles well when the slices are few and adjacent. Chicago at 30 % against Hamburg at 12 % is obvious; Atlanta at 9 % against Munich at 10 % is not, and nobody can tell 3.9 % from 5.4 % by angle. A practical limit is five to seven slices. Above that, either the small ones go into Other, or the question is really a ranking and a bar chart answers it better.
Sort the slices by value, largest first, starting at 12 o'clock and running clockwise. In the native pie and donut this is the sort order of the visual (sort by the measure, descending); make sure it is not sorted by the plant name.
Top N + Other in DAX
The native pie has no Other. Power BI's Top N filter keeps the top six plants and drops the rest, which silently changes the total: the six plants now add up to 100 %, and Chicago's 30 % becomes 38 %. The fix is a measure that keeps the top N and sums everything else into an Other row. It needs an axis table that contains the plants plus one extra row:
Plant Group =
UNION ( DISTINCT ( Plant[Plant] ), ROW ( "Plant", "Other" ) )
Leave Plant Group unrelated to the model, put Plant Group[Plant] on the pie's legend and use this measure as the value:
Revenue (Top N + Other) =
VAR TopCount = 6
VAR CurrentGroup = SELECTEDVALUE ( 'Plant Group'[Plant] )
VAR TopPlants =
    TOPN ( TopCount, ALLSELECTED ( Plant[Plant] ), [Revenue] )
RETURN
    IF (
        CurrentGroup = "Other",
        CALCULATE ( [Revenue], EXCEPT ( ALLSELECTED ( Plant[Plant] ), TopPlants ) ),
        IF (
            CurrentGroup IN TopPlants,
            CALCULATE ( [Revenue], TREATAS ( { CurrentGroup }, Plant[Plant] ) )
        )
    )
Plants outside the top six return blank and disappear from the legend, and Other carries their sum, so the total stays $39.7M. Slicers on region or year still work, because ALLSELECTED respects them.
Two things the measure cannot do. It cannot tell the reader which plants are in Other; for that, add a tooltip page that lists the plants with NOT ( Plant[Plant] IN TopPlants ), or at least name the slice "Other (4 plants)" with a measure for the label. And it ranks by this period only, which matters as soon as you compare with last year (more on that below).
A threshold often works better than a fixed count: fold every plant under 3 % of the total, but keep at most six. That is a FILTER on the share instead of TOPN, and it avoids a pie where the sixth slice is 1 %.
Why the labels add up to 102 %
Each data label is rounded on its own. Six equal parts are 16.67 % each, rounded to 17 % six times: the labels say 102 %. Ten plants with realistic shares will often land on 99 % or 101 %. It is a small error, and it is the first thing a sceptical reader checks.
Largest-remainder rounding (also called Hamilton's method) fixes it:
- Round every share down to a whole percent.
- Count the points still missing to reach 100.
- Give one point each to the shares with the largest remainders.
For six equal parts: six times 16, which is 96; four points are missing; the four largest remainders (all 0.67 here, so the first four in order) get one each. The labels read 17, 17, 17, 17, 16, 16, which is 100. Every label is within one point of its true value, and the total is exact.
This is awkward in DAX because each label depends on all the others, but it can be done with a ranking of remainders over ALLSELECTED and a comparison with the number of missing points. If you do it, use the same rounding in the tooltip and the table, or the numbers will disagree between the chart and the export.
Donut, nested donut or small multiples?
A donut is a pie with the middle removed, and the middle is useful: put the total there ("$39.7M Revenue") and the reader has the scale of the whole without a separate card.
When there is a second split, such as product line within each region, a nested donut puts the regions on the inner ring and the product lines on an outer ring, each in shades of its region's colour. It works for two or three inner parts. With more, use small multiples: one donut per region or per quarter, side by side with a shared legend and each panel's total in its centre. Small multiples answer "is the mix the same everywhere?", which a single nested donut answers badly.
Showing last year on the same pie
The most common follow-up to a pie is "and last year?". Two pies side by side make the reader compare angles across charts, which is the hardest comparison there is. Two better options:
- A thin outer ring with last year's mix around this year's donut, in the same colours, so each slice can be compared with the arc just outside it.
- The share shift on every label: "Hamburg 12 %, −4.0 pp".
The share shift is this year's share minus last year's share, each over its own year's total:
Share shift (pp) =
VAR ShareNow =
    DIVIDE ( [Revenue], CALCULATE ( [Revenue], ALLSELECTED ( Plant[Plant] ) ) )
VAR ShareLY =
    DIVIDE ( [Revenue LY], CALCULATE ( [Revenue LY], ALLSELECTED ( Plant[Plant] ) ) )
RETURN
    ( ShareNow - ShareLY ) * 100
With Top N + Other, rank both years by this year's revenue, so Other contains the same plants in both numbers. Otherwise a plant that fell out of the top six moves into Other and Other appears to "grow" for a reason that has nothing to do with the mix.
The share shift does not say why a slice changed. When the whole grows, a slice can lose share while its revenue rises. Splitting the change into volume (the whole grew), mix (the share moved) and, with quantities, price is a price-volume-mix bridge, and it belongs next to the pie rather than in it.
The checklist, and a visual that does it
For any pie in Power BI: five to seven slices, sorted from 12 o'clock; the rest in a named Other whose members can be seen; labels that add up to 100; the total in the middle; last year as a ring or as a shift in points, not as a second pie.
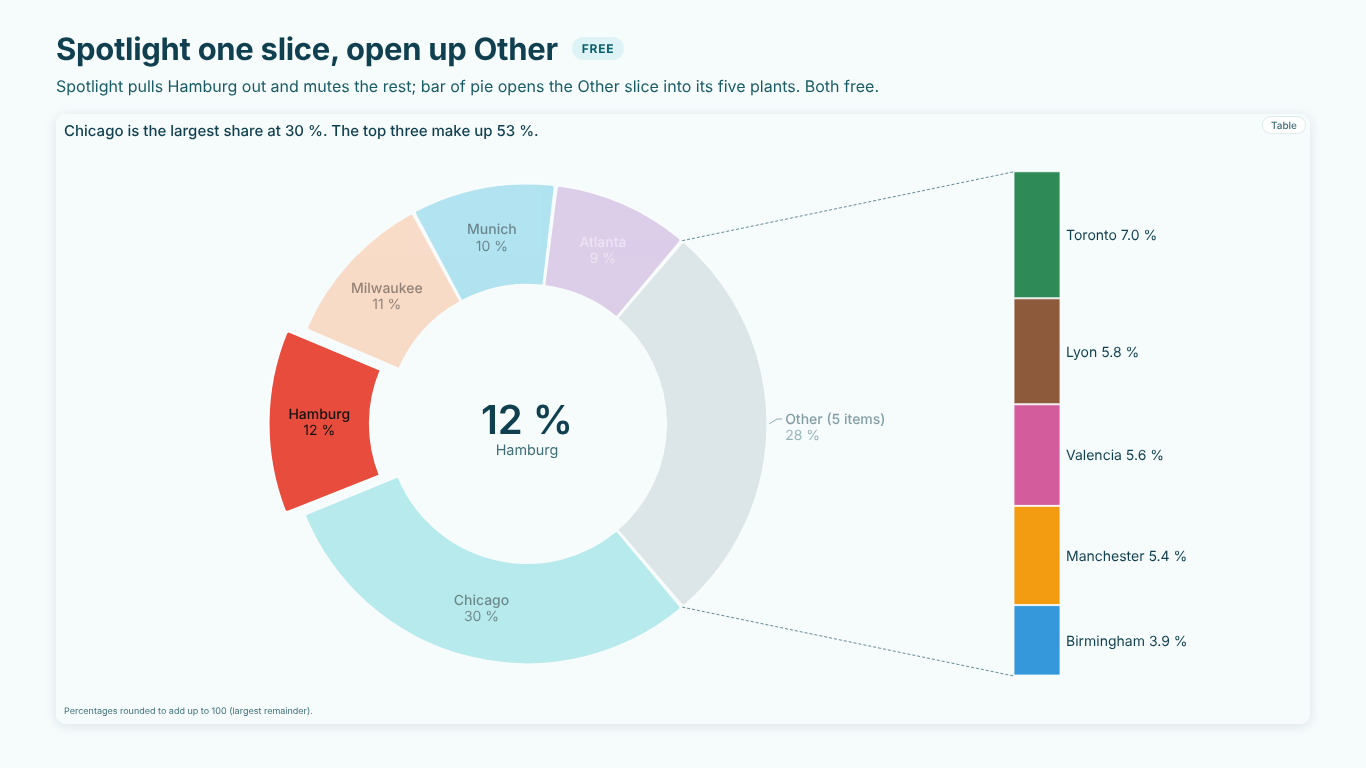
SmartVisuals Pie & Donut has these as defaults. It sorts from 12 o'clock, keeps the top six and folds anything under 3 % into "Other (4 items)", lists Other's members on hover and in the data table, rounds by largest remainder and puts the total in the centre. Bar of pie opens Other into a bar next to the pie, Segment draws a nested donut, Spotlight pulls out one slice, and small multiples draw one donut per value. All of that is free and never watermarked.
Premium, the mix review, adds last year's ring and the share shift in points on every slice, a share bridge of the points won and lost, volume vs mix vs price, budgets per slice, a test of whether the mix change is real when the values are counts, HHI and play over periods, for $1.99 per user per month or $19 per user per year. The same view is part of SmartVisuals Part-to-Whole with six other part-to-whole charts. Both have been submitted to Microsoft Marketplace and are not published yet; the product pages will link to the listings once they are live.
Try AI Chatbot for Free
Experience the power of conversational analytics in your Power BI reports. Get your free license in seconds - no credit card required.
Get Free License