
How do I make a pie or donut chart in Power BI that people can actually read?
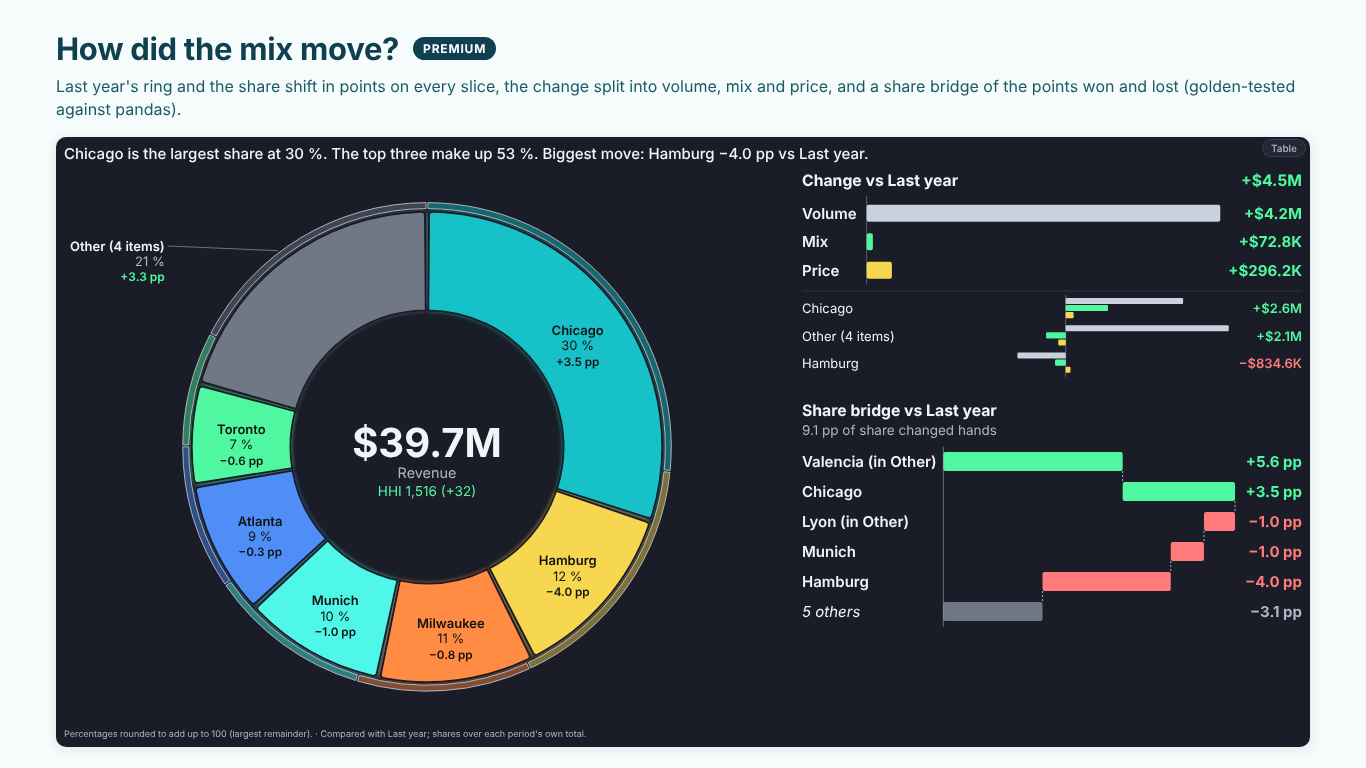
Drop the parts into Category (plants, products, regions) and a measure into Values. SmartVisuals Pie & Donut opens as a donut sorted largest first from 12 o'clock, groups the long tail into a labelled Other, rounds the percentages by largest remainder so they add up to exactly 100 % and puts the total in the centre. A smart caption above the chart says what matters in one sentence: "Chicago is the largest share at 30 %. The top three make up 53 %."
Labels sit inside, outside with leader lines, or wherever they fit (Data Labels > Position > Auto), and a label that does not fit is dropped whole instead of cut. Negative and blank values cannot be part of a whole, so they are left out of the shares and counted in the footnote rather than silently dropped. With more than seven slices, an edit-mode hint suggests grouping the small ones into Other or showing them as a bar of pie.