Process map from an event log in Power BI: directly-follows pairs, loops, ties and honest waiting times
Most companies have an event log and do not call it one. The order history in the ERP, the status changes of a service ticket, the approval trail of a purchase request: each is a table where every row says which case, which step and when. Three columns are enough to draw what really happens in a process, as opposed to what the procedure says should happen.
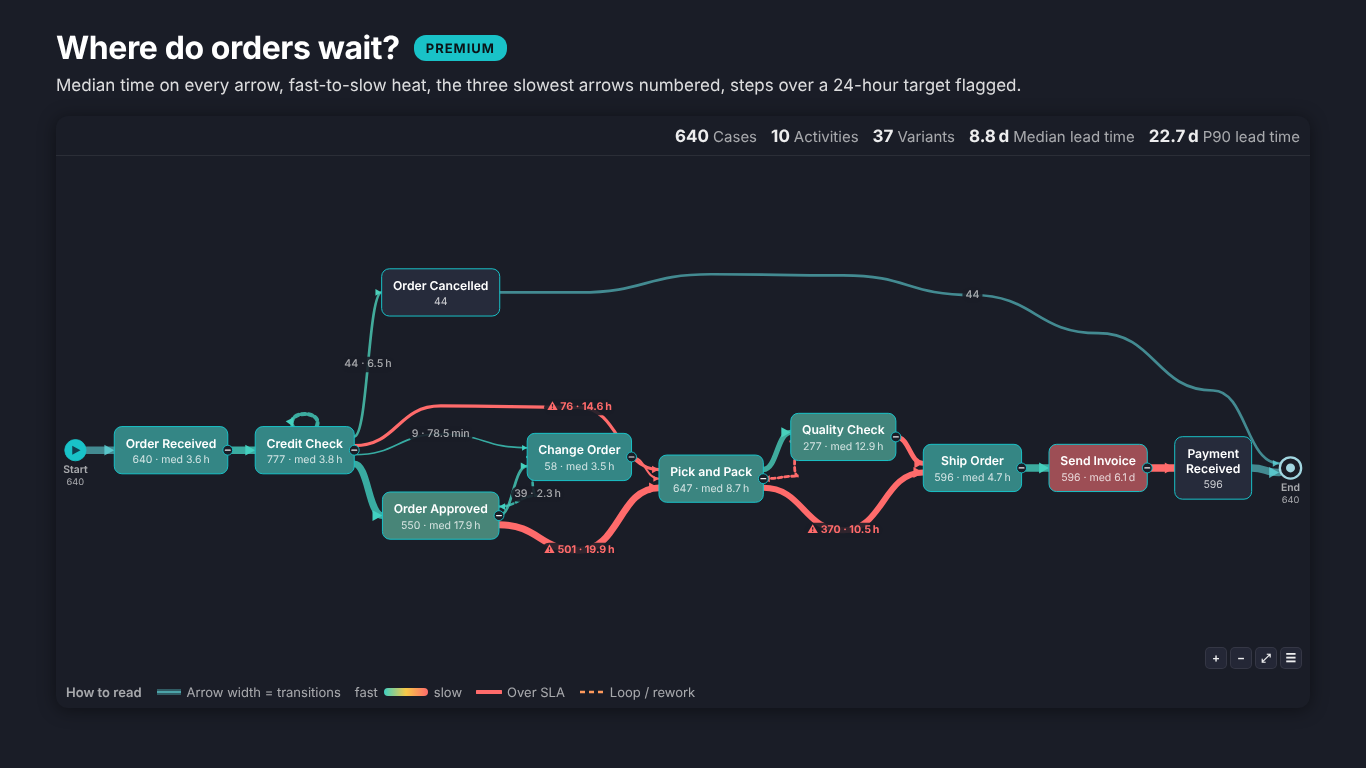
The picture is a process map: one box per activity and one arrow for every "this step was directly followed by that step", with the arrow's width or label giving how often. Power BI has no process map visual of its own, but the data preparation behind one is the same whatever draws it. This article builds it in Power Query, then goes through the decisions that make the map trustworthy.
The event log
The input is one row per event:
| Case ID | Activity | Start | End |
|---|---|---|---|
| SO-26000 | Order Received | 2026-01-05 10:52 | 2026-01-05 11:19 |
| SO-26000 | Credit Check | 2026-01-05 16:04 | 2026-01-05 16:38 |
| SO-26000 | Order Approved | 2026-01-06 09:12 | 2026-01-06 09:20 |
The case is the thing that moves through the process: an order, a ticket, a claim. The activity is the step. The start timestamp orders the steps; the end timestamp is optional but, as we will see, it is what separates work from waiting.
Directly-follows pairs in Power Query
A process map is drawn from pairs: for every case, each event joined to the next event of the same case. In Power Query that is a sort, an index per case and a self-join on the index shifted by one:
let
    Source = EventLog,
    Typed = Table.TransformColumnTypes(Source, {{"Start", type datetime}, {"End", type datetime}}),
    Sorted = Table.Sort(Typed, {{"Case ID", Order.Ascending}, {"Start", Order.Ascending}, {"Activity", Order.Ascending}}),
    Grouped = Table.Group(Sorted, {"Case ID"},
        {{"Events", each Table.AddIndexColumn(_, "Step", 0, 1), type table}}),
    Numbered = Table.ExpandTableColumn(Grouped, "Events", {"Activity", "Start", "End", "Step"}),
    Next = Table.TransformColumns(Numbered, {{"Step", each _ - 1, Int64.Type}}),
    Joined = Table.NestedJoin(Numbered, {"Case ID", "Step"}, Next, {"Case ID", "Step"}, "Next", JoinKind.LeftOuter),
    Expanded = Table.ExpandTableColumn(Joined, "Next", {"Activity", "Start"}, {"To", "Next Start"}),
    WithEnd = Table.ReplaceValue(Expanded, null, "End", Replacer.ReplaceValue, {"To"}),
    Hours = Table.AddColumn(WithEnd, "Wait Hours", each
        if [Next Start] = null then null
        else Number.Max({0, Duration.TotalHours([Next Start] - (if [End] = null then [Start] else [End]))}),
        type number),
    Pairs = Table.RenameColumns(Hours, {{"Activity", "From"}})
in
    Pairs
Each row of Pairs is one case taking one step. The last event of every case gets "End" as its successor; a second query that takes the Step = 0 rows as From = "Start" adds the start marker. Group by From and To to get one row per arrow with a count and an average wait, and a ten-million-row log shrinks to a few hundred rows that any visual can draw.
The table has one row per transition, so the arrow's count is COUNTROWS ( Pairs ) and the share of cases is the number of distinct cases on that arrow divided by all cases. Keep both: a step repeated three times in one case adds three transitions but only one case.
Ties: two steps at the same second
The sort above has a third key, Activity, and it is there for a reason. Many logs record the date only, or round to the minute, so two steps of one case share a timestamp. Without a rule, the order between them depends on how the source happened to deliver the rows, and the same case can produce a different path on the next refresh.
Sorting tied events by activity name makes the map stable, but it is still a guess: "Invoice Sent" would always come before "Order Shipped" just because I comes before O. If the source has a step number or a sequence column, sort by it instead. If it does not, count the ties and show the count somewhere: a reader deserves to know that 4 % of cases had two steps at the same moment.
Loops are information
Rework shows up as a pair whose To is a step that already happened in the case: Credit Check, then Order Changed, then Credit Check again. In a process map that is an arrow pointing backwards, and it is often the most useful arrow on the page, because rework costs time and nobody plans for it.
Two things go wrong here. The first is renaming the repeat ("Credit Check 2") so the chart stays a neat left-to-right flow: the map then has two boxes for one activity and understates how often the step really runs. The second is counting the step directly followed by itself (two Credit Check rows in a row) as nothing. It is a self-loop and belongs on the map as a small arrow on top of the box.
Time on the arrow, not only in the box
There are two different times in an event log, and averaging them together hides the interesting one.
- Processing time is inside the box: from a step's start to its end. It needs the End column.
- Waiting time is on the arrow: from the end of one step to the start of the next. That is where cases queue.
The Wait Hours column above measures from the end of the step when the log has one, and from its start otherwise, and it never goes below zero: overlapping steps wait zero, not minus two hours. On the Helios sample order log, picking itself takes about an hour and a half while the median wait before it is close to a day. The bottleneck is a queue, not a task, and it only shows if the time sits on the arrow.
Median, not mean
Waiting times are skewed. Most orders wait a few hours, a handful wait three weeks because a customer went quiet, and those few drag the average up until it describes nobody. Report the median as the typical wait and the 90th percentile as the bad case; keep the mean for capacity sums, where it is the right number. In DAX, MEDIANX ( Pairs, Pairs[Wait Hours] ) and PERCENTILEX.INC ( Pairs, Pairs[Wait Hours], 0.9 ) on the event-level table do it; on the grouped table they cannot, because the individual waits are gone.
Whatever you choose, say it in the tooltip. "Avg 19.9 h" and "median 19.9 h" are different claims.
Variants: the paths that actually happen
A variant is the full sequence of steps of one case. Concatenate each case's activities in order (Text.Combine over the sorted events in Power Query) and count cases per variant. On a typical order-to-cash log a handful of variants cover most cases and a long tail covers the rest, often one case each. The most frequent variant is a good candidate for the reference path; the tail is where the exceptions, workarounds and data errors live.
Show the top variants with their share of cases, and let the reader click one to see its path on the map. Hiding the tail is fine, as long as the map says what share of cases it still covers.
When the recipe is not enough
The Power Query route works and teaches you the data. It gets heavy when people want to click a step and filter the report by its cases, see the median and the 90th percentile on every arrow, check cases against an accepted path, or compare two quarters on one map.
That is what SmartVisuals Flow Chart is for. It takes the event log as it is (Case ID, Activity, Timestamp, optional End Timestamp and Sort Order for ties), or From and To pairs with Value and Duration, or a flat table with one column per level. It finds the steps, draws loops and self-loops dashed, counts every path and shows the average time per step with the definition in the tooltip. The free version has no node cap and adds flowchart symbols, notes and links per step, the top 5 variants with click-to-trace, collapse, search, subprocesses and a data-quality table that counts tied timestamps, rows left out and events ending before they start.
Premium ($1.99 per user per month or $19 per user per year) is process mining lite: median, 90th percentile or mean on every arrow, waiting versus processing time, bottlenecks, SLA targets, rework rate, conformance against one or several accepted paths, the variant explorer, swimlanes with handoffs, a case list, comparison of two periods or segments, small multiples, a time-true replay and CSV export. Directly-follows counts, transition times, variants, rework and conformance are tested against an independent process-mining reference, and percentiles against numpy and scipy. The visual has been submitted to Microsoft Marketplace and is not published there yet; the product page will link to the listing once it is live.
If you stay with Power Query, the checklist is short: sort with a tie rule and count the ties, keep loops as loops, put waiting time on the arrows and processing time in the boxes, report the median with the 90th percentile, and tell the reader what share of cases the drawn variants cover.
Try AI Chatbot for Free
Experience the power of conversational analytics in your Power BI reports. Get your free license in seconds - no credit card required.
Get Free License