- The setup guide says "Still missing: Timestamp".
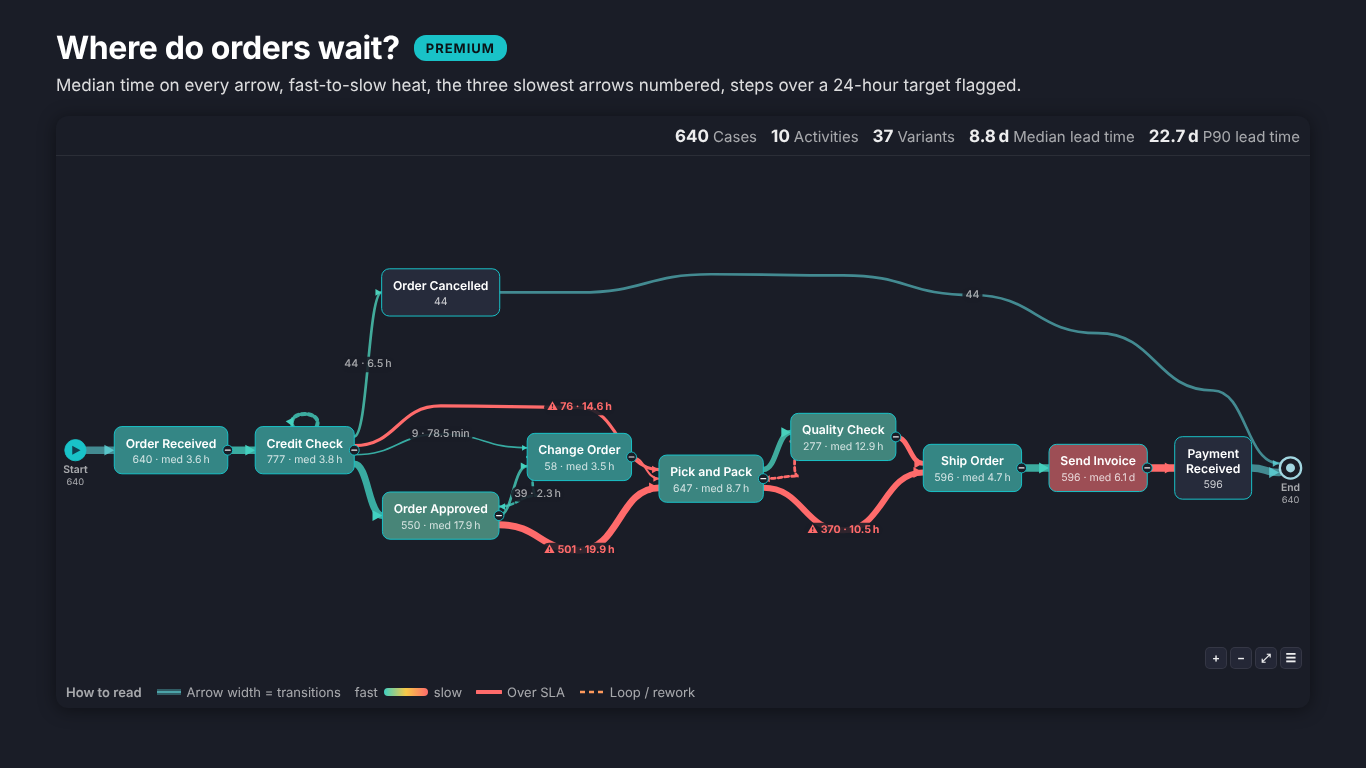
- An event log needs Case ID, Activity and Timestamp together; bind the third field. Pairs need From and To, a flat table at least two columns in Levels (in order). In edit mode See an example draws a built-in Helios order-to-cash log, which disappears as soon as you add your fields.
- Steps appear in the wrong order.
- Two steps of the same case share a timestamp, so their order is a guess: ties sort by activity name. Bind Sort Order (a step number) or use a more precise timestamp. The data table (T) counts the steps that share a timestamp in its data-quality check.
- The times look 24 times too long or too short.
- Numeric timestamps are read in hours by default. Set Time Units > Numeric Timestamps Are to the unit of your data; for pairs, Time Units > Duration Field Is In sets the unit of Duration. Date and time columns need no setting.
- A status note says rows were left out, or that events ended before they started.
- Rows without a case, an activity or a timestamp are left out and counted. An End Timestamp earlier than its Timestamp is set to the start and counted too. The data table (T) opens with the full data-quality check: rows received, rows left out, events ending before they start, single-event cases, tied timestamps and the time span.
- There are fewer variants than I expected, or a note says "Showing N of M variants".
- Layout > Show Variants Covering (% of Cases) is below 100, so only the variants that cover that share of cases are drawn. Set it to 100 to draw every path. The free variants panel lists the top 5; Variant Explorer (Premium) lists every variant with its share and lead time.
- A warning says only the first rows are shown.
- The event log reads up to 300,000 events. For bigger logs, aggregate the log to From, To, Value and Duration in Power Query and bind the pairs instead; the Insights article below shows the Power Query steps. A click on an arrow or variant with more than 1,000 cases filters the other visuals by Case ID.
- A box called "Other steps" appeared.
- Layout > Keep the Top N Steps (0 = all) is above 0, so the rarest steps are merged into one box. Every count stays exact either way. Set it to 0 to show every step.
- A box image or a link icon does not show.
- Box Image takes data:image/...;base64 values only; web addresses are ignored on purpose, because the visual makes no network calls. A Link value must start with https:// or http://, other schemes are refused.
- Durations, swimlanes or the comparison disappear for some readers.
- They are Premium and need a licence per reader, assigned in the Microsoft 365 admin center. Readers without one see the free map of the same data and a short Power BI notice, never a blank or watermarked visual. In edit mode every Premium feature previews in full.
- The Download CSV button does nothing.
- Interaction > Export Button (Premium) saves steps, transitions and variants through Power BI's own download service, which your tenant admin can switch off for custom visuals. When downloads are not allowed the button does nothing and the rest of the visual works as usual.