Progress to target in Power BI: pace, projected landing and the run rate you still need
"Revenue is at 59 % of the annual target." Is that good? On the 1st of April it is excellent. On the 15th of December it is a disaster. A progress bar, a gauge or a ring that shows the share of target without the share of the year forces every reader to do that calculation in their head, and most will not.
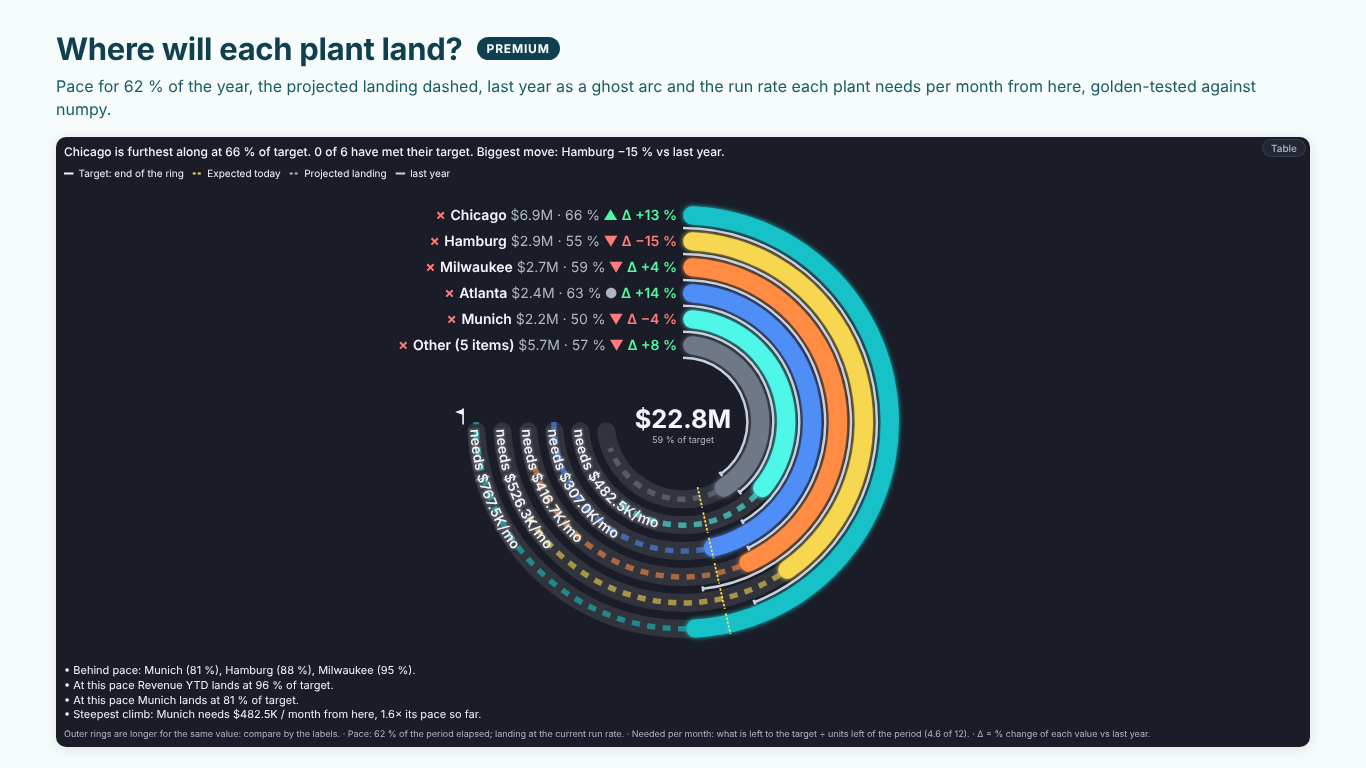
This article adds the missing reference. It builds three measures on top of an actual and a target: pace (where you should be by now), projected landing (where you will end at the current rate) and required run rate (what each part needs per month from here). The example is Helios Manufacturing's revenue by plant at 62 % of the year, with annual targets per plant.
Share of the period elapsed
Everything starts from one number: how much of the period is gone. For a calendar year, with the last date that has actuals as "today":
Year Elapsed =
VAR LastActual =
    CALCULATE ( MAX ( Sales[Date] ), REMOVEFILTERS ( Plant ) )
VAR YearStart = DATE ( YEAR ( LastActual ), 1, 1 )
VAR YearEnd = DATE ( YEAR ( LastActual ), 12, 31 )
RETURN
    DIVIDE ( LastActual - YearStart + 1, YearEnd - YearStart + 1 )
Use the last date with data rather than TODAY (): a report refreshed on Monday morning should not look behind because the weekend counted and its sales did not. For a fiscal year, change the two dates; for a quarter, use the quarter's start and end. If months are the grain of your actuals, count closed months instead (seven closed months of twelve is 58 %), and say so in the report.
REMOVEFILTERS ( Plant ) makes every plant use the same date, so a plant that has not posted yet this week does not get its own, earlier "today".
Pace: where should we be by now?
The simplest expectation is linear: by 62 % of the year, 62 % of the target.
Expected Today =
[Revenue Target] * [Year Elapsed]

Pace % =
DIVIDE ( [Revenue YTD], [Expected Today] )
Munich has $2.2M of a $4.4M target. At 62 % of the year it should be at $2.73M, so it is at 81 % of pace: behind. Chicago has $6.9M of $10.4M, which is only 66 % of its target, but 107 % of pace: ahead. Ranked by share of target, Chicago and Munich look like neighbours; ranked by pace they are on opposite sides of the line.
A tolerance band keeps the status from flickering: call a plant on track within 5 % of pace, behind below, ahead above.
Revenue is rarely linear. If December is always a third of the year, a linear pace calls every plant "ahead" in the autumn. When a monthly budget exists, use the cumulative plan to date instead of the straight line:
Plan To Date =
CALCULATE ( [Revenue Plan], DATESYTD ( 'Date'[Date] ) )

Pace % (plan) =
DIVIDE ( [Revenue YTD], [Plan To Date] )
Filter 'Date' to the last actual date (or to the closed months) for this measure, or the plan will run to the end of the year.
Projected landing: where will we end?
If the plant keeps its average rate so far, it lands at:
Projected Landing =
DIVIDE ( [Revenue YTD], [Year Elapsed] )

Landing % of Target =
DIVIDE ( [Projected Landing], [Revenue Target] )
Munich: $2.2M ÷ 0.62 = $3.55M, which is 81 % of target. Hamburg: $2.9M ÷ 0.62 = $4.68M, 88 % of its $5.3M. Chicago lands at $11.1M, 107 %. With a plan to date, the landing becomes actual × target ÷ plan to date, which assumes the plant keeps its ratio to plan rather than its average rate.
This is a run-rate projection, not a forecast. It knows nothing about the pipeline, seasonality beyond the plan or a large order in November. Label it "at this pace" so nobody mistakes it for one.
Required run rate: what does each plant need from here?
The number a plant manager can act on is not the landing but the gap, expressed per month:
Months Left =
12 * ( 1 - [Year Elapsed] )

Needed per Month =
DIVIDE ( [Revenue Target] - [Revenue YTD], [Months Left] )

Pace So Far per Month =
DIVIDE ( [Revenue YTD], 12 * [Year Elapsed] )

Climb =
DIVIDE ( [Needed per Month], [Pace So Far per Month] )
Munich has $2.2M left to find in 4.6 months: it needs $482.5K a month. So far it has made $296K a month, so the climb is 1.6 times its pace. That is a sentence a review meeting can discuss: "Munich needs to sell 60 % more per month than it has so far." A plant that has already met its target needs nothing; return blank instead of a negative number, and show "target met".
When the period is over and the target was missed, there is no run rate left. Show the shortfall ("period over, $310K short") instead of dividing by zero months.
Drawing it: rings, ticks and dashed landings
A bar chart with target markers can show all of this, but progress rings have one advantage: every ring can run to its own target, so a plant with a $10.4M target and one with a $0.6M target read on the same scale (the full ring is 100 %). Add three marks:
- a short tick on each ring where it should be today (the pace),
- the ring's continuation as a dashed arc to the projected landing,
- the required run rate written at the end of the ring ("needs $482.5K/mo").
One caveat: on a ring chart the outer rings are longer than the inner ones for the same angle. Compare by the labels and the angle, never by length, and say so in a footnote. Status needs more than colour: a check mark, an approximate sign and a cross for met, close and missed keep the chart readable for colour-blind readers and in print.
The same in one visual
The measures above are the whole method. SmartVisuals Radial Bar draws it: radial bars on a shared maximum, progress rings that each run to their own target, or a single ring for a KPI tile, with met, close and missed by colour and by symbol, status bands on the track and a caption that counts who made it. Targets and status bands are free and never watermarked.
Premium, "where will we land?", adds the pace tick from a Period elapsed field, a typed share or the period dates (or a Plan to date measure), the projected landing as a dashed arc, the required run rate per month, week, quarter or day, last period's ghost arc, findings with how each number was calculated, and small multiples, for $1.99 per user per month or $19 per user per year. The pace numbers are golden-tested against numpy. The same view is part of SmartVisuals Part-to-Whole with pie and donut, rose, waffle, pictogram, funnel and Marimekko. Both have been submitted to Microsoft Marketplace and are not published yet; the product pages will link to the listings once they are live.
Whatever you draw it with, never show a share of target without the share of the period next to it.
Try AI Chatbot for Free
Experience the power of conversational analytics in your Power BI reports. Get your free license in seconds - no credit card required.
Get Free License