Radial Bar

    Progress rings that say where you will land

    Radial bars on a shared maximum, rings to each target with met or missed by colour and symbol, status bands for free. Premium adds pace, the projected landing and the run rate each ring needs.

    Read the documentationComing soon to Microsoft Marketplace
    Datasheet
    Status
    Coming soon to Microsoft Marketplace
    Price
    $1.99 /user/mo · $19 /user/yr
    Licensing
    Per user, assigned in the Microsoft 365 admin center, with a 30-day free trial. Unlicensed viewers see the free tier, never a blocked visual.
    Data
    Computed inside Power BI. No external calls, no API keys, no telemetry.
    Visuals API
    5.11.0
    Layouts
    Radial bars on a shared maximum, progress rings to each target, single ring (KPI); 270°, full circle or semicircle
    Accessibility
    One tab stop with arrow-key navigation, screen-reader live region, accessible data table, status by symbol as well as colour, high contrast with fill patterns, focus outline, minimum text size and Reduce motion
    Languages
    20: English, Czech, Danish, Dutch, French, German, Hungarian, Italian, Japanese, Korean, Norwegian, Polish, Portuguese (Brazil), Portuguese (Portugal), Slovak, Spanish, Swedish, Turkish, Chinese (Simplified), Chinese (Traditional)
    Statistics
    Pace, landing and run rate computed inside the visual, golden-tested against numpy
    Network
    No external calls, no telemetry
    Works in
    Power BI Desktop, Service, Embedded
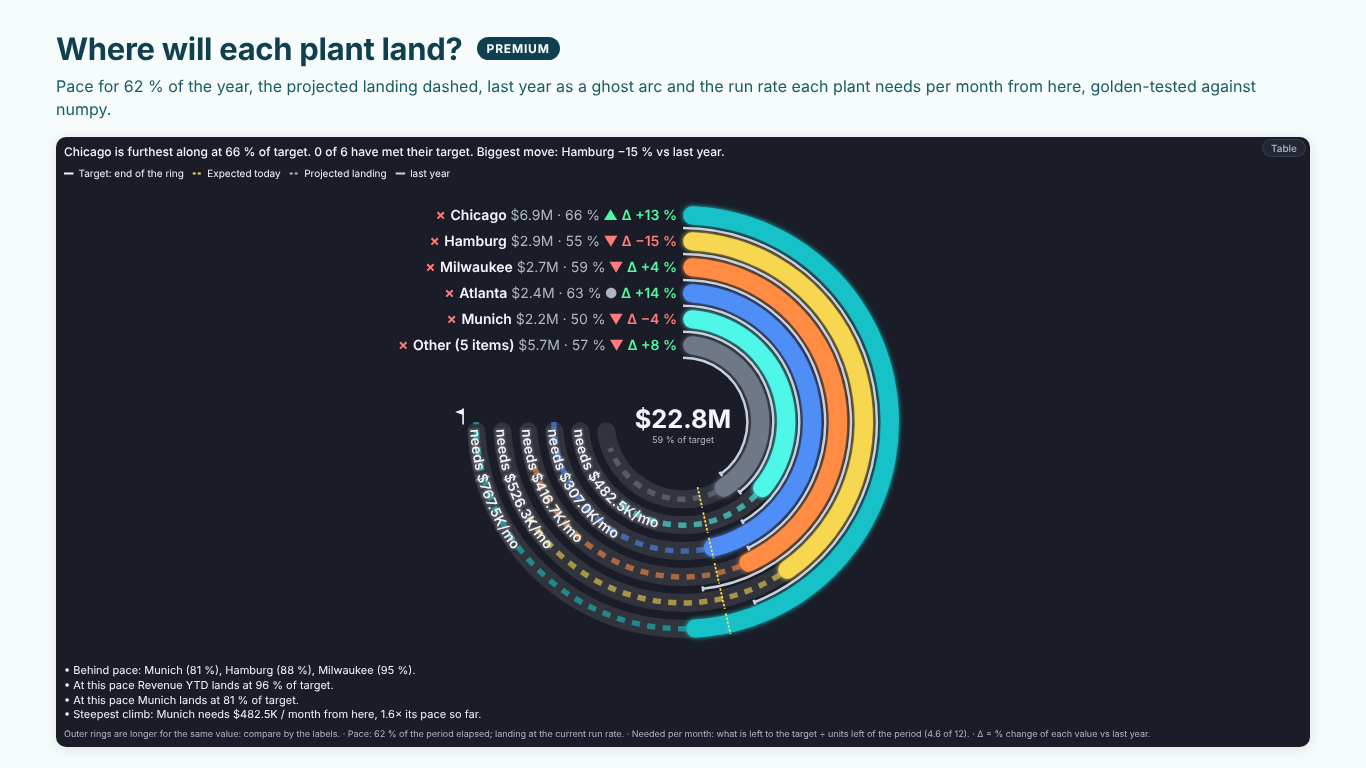
    Dark progress rings of revenue YTD by plant with an expected-today line, dashed projected landings, last year's ghost arcs and the monthly run rate each plant needs
    Pl. LV  ·  Radial Bar  ·  Where will each plant land? Pace at 62 % of the year, projected landing, last year's ghost arc and the run rate needed (premium).rendered from the shipped visual
    What it does

    SmartVisuals Radial Bar draws a radial bar chart (circular bar chart), progress rings and a single-ring KPI from the same fields. Bind a category, an actual and a target and every ring runs to its own goal, marked met, close or missed by colour and by symbol, with status bands on the track and a caption that counts who made it. Targets and bands are free.

    Premium answers the question a ring cannot: where will we land? A tick where each ring should be by now, the projected landing as a dashed arc, the run rate each ring needs from here, last period's ghost arc, findings and small multiples. SmartVisuals Part-to-Whole carries the same view next to pie and donut, rose, waffle, pictogram, funnel and Marimekko.

    Free and premium

    Where the line is, exactly.

    Report authors see the full premium set in edit mode, so you can evaluate every feature on your own data before assigning a single licence. Unlicensed viewers always get a working chart.

    Free tierevery viewer
    • Radial bars on a shared maximumA circular value grid and labels at the start of each ring; arc length is proportional to the value.
    • Progress rings and a single ringEach ring to its own target, or one ring with a big number for one KPI.
    • Targets, freeFrom a field or one target for all; met or missed by colour and by symbol, with your own Met at and Close at thresholds, and a darker second lap past the target.
    • Status bands, freeThe track shaded missed, close and met from your thresholds and colours, split by gaps and patterned so colour is never the only cue.
    • ShapeTrack, gap between rings, rounded or square ends, start angle, 270 degrees, full circle or semicircle, inner radius, sort, and a straight-on depth style (no 3D tilt).
    • Centre, labels and OtherCentre total, the hovered ring or a measure of your own; ring labels, a legend, Top N + Other, conditional formatting (fx) and fill patterns.
    • Smart caption and footnoteA caption that names who is furthest along and counts the rings that met their goal, and a methods footnote.
    • Power BI featuresTooltips and report page tooltips, highlight and cross-filter with Ctrl to add, bookmarks, context menu, drilldown, a show condition, six templates, four themes, four fonts, on-object formatting and 20 languages.
    Premium$1.99 /user/mo · first month free
    • PaceA tick where each ring should be by now, from a Period elapsed field, a typed share or the period dates, marked on track, behind or ahead.
    • Projected landingA dashed extension of each ring to where the current run rate, or the plan to date, takes it.
    • Required run rateWhat each ring needs per month, week, quarter or day from here to reach its target, at the ring end, in the tooltip and in the findings.
    • Last period's ghost arcWhere each ring stood last period, with the % change, the value change or the share shift.
    • Findings and small multiplesUp to five findings with how each was calculated, and one set of rings per region or team.
    Getting started

    From empty canvas to first chart.

    1. 01

      Add SmartVisuals Radial Bar to the page and put a field such as Plant or Rep in Category.

    2. 02

      Add the actual, such as Revenue YTD, to Values: radial bars on a shared maximum.

    3. 03

      Add the goal to Target, or type One Target for All: each ring now runs to its own target, marked met, close or missed.

    4. 04

      Turn on Radial Bar > Status Bands on the Track and set Targets > Met at and Close at.

    5. 05

      Add Period elapsed and last year's measure to Compare for pace, landing and the ghost arc, or pick a style under Templates.

    Get Radial Bar

    On its way.

    Installation instructions for both paths are on the download page.

    Microsoft Marketplace (recommended)

    The offer is prepared for Microsoft Marketplace and not published yet. This page will link to the listing the moment it is live.

    Coming soon
    Documentation

    Everything else about Radial Bar.

    The guide, use cases, questions and the full settings reference. Open what you need, or search.

    Search all visuals

    Radial Bar in Power BI, explained

    6 short chapters: what the visual does and why

    Radial bars, progress rings or a single ring: which layout when?

    Radial Bar > Layout offers three readings of the same fields. Radial bars (shared maximum) compare categories with each other: headcount by department, sorted, on one round maximum with a circular value grid, so the arc length is proportional to the value. Progress rings (each to its target) answer "how far along is each one?": every ring runs to its own target, so a plant at 66 % of a $10.4M goal and a plant at 55 % of a $5.3M goal read on the same scale. Single ring (KPI) is one big number on one ring for a KPI card. Auto picks rings when a target is set and bars when not.

    On a ring the outer bars are longer than the inner ones for the same value, which is why the labels carry the numbers and the footnote says "Outer rings are longer for the same value: compare by the labels." Sorting and Other keeps the eight largest by default and folds the rest into Other; with more than twelve rings an edit-mode hint suggests keeping eight or fewer, because rings get hard to read.


    How do I show progress to target per plant or rep?

    Put the plant or rep in Category, the actual (Revenue YTD, Bookings Q3) in Values and the goal in Target, or type One Target for All under Targets. Each ring ends at its target, and Targets > Met at (% of target), 100 by default, decides when a ring counts as met: a check mark and the met colour, a cross for missed and an approximate sign for close (Close at, 85 % by default). Colour is never the only cue. A ring past its target draws a darker second lap.

    Radial Bar > Status Bands on the Track shades each track missed, close and met from the same thresholds, split by gaps and patterned. The smart caption counts the rings that made it ("Ava Novak is furthest along at 118 % of target. 2 of 8 have met their target.") and the centre shows the total and its % of target. Targets and bands are free in Radial Bar.


    Where will each ring land? Pace and projected landing (premium)

    Bind Period elapsed (the share of the year gone, 0-1 or %), type it under Pace > Share of Period Elapsed, or type Period Start and Period End as yyyy-mm-dd. Each ring then gets a tick where it should be by now (target × share elapsed), is marked on track, behind or ahead (On Track Within (%), 5 by default), and Projected Landing continues the ring as a dashed arc to where the current run rate takes it. Plan to date replaces the straight-line expectation when the year is not linear.

    Pace > Required Run Rate writes what each ring needs per month, week, quarter or day from here ("needs $482.5K/mo") at the ring end, in the tooltip and in the findings. On the Helios sample at 62 % of the year, Munich has $2.2M of a $4.4M target: it lands at 81 % at its current pace and needs $482.5K a month, 1.6 times its pace so far. Every pace number is golden-tested against numpy.

    How do I compare with last period? (premium)

    Put last year's measure in Compare. Each ring gets a ghost arc where last year stood, and the label shows the % change (Compare > Change Labels switches to the value change or the share shift in points). Findings list up to five things worth saying, such as who is behind pace and where the total lands, each with how it was calculated, and Small multiples draws one set of rings per region.

    Can I style it as a gauge or a KPI tile?

    Radial Bar > Arc draws three quarters (270°, the default), a full circle or a semicircle; Start Angle rotates it, Inner Radius (%) and Gap Between Rings (%) set the proportions, Bar Ends are rounded or square and Track draws the empty part. Ring Labels sit at the start of each ring or the end of each bar. Depth Style (no tilt) adds a straight-on bevel and soft shadow with true lengths; there is no tilted 3D.

    The Centre shows the total, the hovered ring or a Centre value measure of your own, with a caption under it. Six templates (Executive, IBCS (Finance), Minimal, Presentation, Print, Infographic) and four themes set the look in one step.

    Radial Bar or the Part-to-Whole multi-view?

    SmartVisuals Radial Bar is the single-view edition at $1.99 per user per month or $19 per user per year, with the first month free. SmartVisuals Part-to-Whole, at $4.49 per user per month or $45 per user per year, holds this view plus pie and donut, rose, waffle, pictogram, funnel and Marimekko over the same fields, with the same free tier and premium layer. Licences do not carry across offers: for one or two chart types the single views cost less, for three or more the multi-view does.

    Use cases

    Where Radial Bar earns its place

    Plant revenue to the annual target

    Helios puts Plant in Category, Revenue YTD in Values and Revenue Target in Target. Each ring runs to its own plant's target, marked met, close or missed by colour and symbol, and the caption reads "Chicago is furthest along at 66 % of target. 0 of 6 have met their target." With Year Elapsed in Period elapsed and Revenue YTD PY in Compare (premium), every ring also gets the expected-today tick, a dashed projected landing and last year's ghost arc.

    Quarterly quota attainment per rep

    Sales operations binds Rep, Bookings Q3 and Quota Q3 and turns on Radial Bar > Status Bands on the Track. Each track is shaded missed below 85 % and close from 85 % to 100 % (Targets > Close at and Met at), and a rep past quota gets a darker second lap. Targets and bands are free.

    KPI tiles for the management page

    Three copies of the visual with Radial Bar > Layout set to Single ring (KPI): Revenue YTD against its target, Headcount against the approved headcount and Q3 bookings against quota, each with a big number, its % of target and status bands.

    Headcount by department

    HR puts Department in Category and Headcount in Values without a target: radial bars on a shared maximum with a circular value grid, sorted from Production at 412 to HR at 27, with the total in the centre.

    Questions

    12 questions asked before you did

    More questions? Write to us.

    Every layout is free: radial bars, progress rings and the single ring, targets with met, close and missed status, status bands, the centre, labels, Top N + Other, templates, themes and every accessibility feature. Premium (where will we land?) adds pace, the projected landing, the required run rate, last period's ghost arc, findings and small multiples, for $1.99 per user per month or $19 per user per year, with the first month free. Premium previews in full in Power BI Desktop and edit mode; readers without a licence see the free chart, with no watermark and nothing blocked.

    SmartVisuals Radial Bar has been submitted to Microsoft Marketplace and is not published yet. This page will link to the listing once it is live.

    Category and one measure in Values. Optional: Target (a goal per ring), Compare (last period or plan), Period elapsed (share of the period gone, 0-1 or %), Plan to date (where the actual should be today, if not linear), Annotation, Small multiples, Tooltips, Centre value and Show condition.

    An outer ring has a larger circumference, so the same angle is a longer arc. Compare rings by their labels and the angle they cover, not by length; the footnote says so. Radial Bar > Gap Between Rings (%) and Inner Radius (%) reduce the difference.

    Expected today = target × share of the period elapsed (or the Plan to date measure). A ring is behind when the actual is more than On Track Within (%) below that. The landing is actual ÷ share elapsed (or actual × target ÷ plan to date), and the run rate needed is (target − actual) ÷ the units left in the period. The findings show the formulas under How calculated.

    Pace needs a target and the share of the period elapsed. Bind Target or type One Target for All, then bind Period elapsed, type Pace > Share of Period Elapsed, or type Period Start and Period End as yyyy-mm-dd. The edit-mode hint names what is missing.

    No. The visual declares no network privileges, makes no external calls and sends no telemetry. Pace, landing and run rate are computed inside the visual in your report. The licence is checked through Power BI's own licensing service.

    Radial Bar is the single-view edition at $1.99. SmartVisuals Part-to-Whole ($4.49) adds pie and donut, rose, waffle, pictogram, funnel and Marimekko views over the same fields, with the same engine. Microsoft licenses every offer separately, so a licence for one never unlocks the other.

    Yes. The chart is one tab stop: the arrow keys walk the rings, Home and End jump to the first and last, Enter or Space selects (Ctrl adds), and Escape clears. A polite live region reads each ring, and the Table button opens an accessible data table. Met, close and missed carry a symbol as well as a colour.

    Yes: Radial Bar > Layout > Single ring (KPI) draws one ring with a big number and its % of target, with status bands if you like. Arc sets 270 degrees, a full circle or a semicircle.

    20: English, Czech, Danish, Dutch, French, German, Hungarian, Italian, Japanese, Korean, Norwegian, Polish, Portuguese (Brazil), Portuguese (Portugal), Slovak, Spanish, Swedish, Turkish and Chinese (Simplified and Traditional), for the format pane and every string the visual writes. Numbers follow the report's locale.

    Post it on the public board at smartvisuals.io/feedback, where other users can vote and comment, or use the Report a bug block on the support page (smartvisuals.io/support) or email hello@smartvisuals.io. A screenshot and the fields you bound help most.

    Troubleshooting

    When it does not look right

    Found a bug or missing something? Post it on the requests board; the developer answers within two business days.

    Rings run to the axis maximum instead of to their targets.
    Those items have no target: the edit-mode hint counts them. Bind Target with a value for every item, or type Targets > One Target for All. With Layout set to Auto, the rings switch to progress rings as soon as a target is set.
    Pace shows no tick.
    Pace needs a target and the share of the period elapsed. Bind Period elapsed (0-1 or %), type Pace > Share of Period Elapsed, or type Period Start and Period End as yyyy-mm-dd; the hint says which one is missing. If the dates do not read as yyyy-mm-dd, or the end is before the start, the hint says that too.
    The run rate is not shown although the pace is.
    Required Run Rate needs the share of the period elapsed; a Plan to date measure alone is not enough. Add Period elapsed, a typed share or the period dates, and set Run Rate per and, if your period is not a year, Units in the Whole Period.
    Status bands do not appear.
    Status bands are drawn on the track of each ring from its target, so they need Target or One Target for All; in edit mode the hint says "Status bands need a target" when it is missing. On a very small tile the bands are left out.
    The outer rings look longer for the same value.
    An outer ring has a larger circumference, so the same angle is a longer arc; the footnote says so. Compare rings by their labels and their angle. A larger Inner Radius (%) reduces the difference.
    Premium features show in Desktop but not for some readers.
    Premium previews in full in Power BI Desktop and edit mode. In reading view a reader without a licence sees the free rings, targets and bands included, with the premium layers set aside in memory, and Power BI shows its own licence banner once; nothing is blocked or watermarked.

    Accessibility

    Keyboard, screen readers and high contrast
    Tab
    Moves into the chart, which is one tab stop; the first ring gets a focus outline. The Table button, and the sort button when it is shown, are separate tab stops.
    Arrow keys
    Move to the next or previous ring.
    Home / End
    Jump to the first or the last ring.
    Page Up / Page Down
    Jump ten rings back or forward.
    Enter or Space
    Selects the focused ring and cross-filters the page. Hold Ctrl to add it to the selection.
    Esc
    Clears the selection.
    • Screen readers

      The chart is labelled with its smart caption, a sentence that says what it shows. A polite live region announces the focused ring as you move, with its name, value and share of the total, such as "Chicago: $6.9M, 30 %"; the ring label carries the % of target and the status mark.

    • Data table

      The Table button in the corner of the visual (Data Table > Table Button in the Visual, on by default) switches between the chart and an accessible table of every ring with its value and share; Data Table > Open as Table starts in the table.

    • Not colour alone

      Met, close and missed carry a check mark, an approximate sign or a cross before each ring label, not only a colour. Status bands on the track are split by gaps and patterned, and Format pane > Accessibility > Patterns (Tell Items Apart Without Colour) gives every ring a fill pattern.

    • High contrast

      In Windows high contrast mode the visual uses the contrast theme's foreground, background and selection colours, ignores the transparent background, and always turns on the fill patterns.

    • Reduced motion

      Accessibility > Reduce Motion, or the operating system's reduced-motion setting, turns off transitions.

    • Focus outline and text size

      Accessibility > Focus Outline Colour and Focus Outline Width (2.5 px by default) set the dashed outline around the focused ring, and Minimum Text Size keeps every label at or above the size you set. Labels that do not fit are dropped whole, never cut or overlapped.

    • Context menu

      Right-clicking a ring or the empty canvas opens the Power BI context menu.

    • Languages

      The format pane, captions, footnotes, findings, tooltips, the data table and the screen-reader labels are available in 20 languages: Chinese (simplified and traditional), Czech, Danish, Dutch, English, French, German, Hungarian, Italian, Japanese, Korean, Norwegian, Polish, Portuguese (Brazil and Portugal), Slovak, Spanish, Swedish and Turkish.

    Missing something?

    Tell us what is missing.

    A feature you need, a bug you hit, a visual that does not exist yet. Every message reaches the person who builds these visuals, and feature requests shape what ships next. We also build visuals to order.

    Also in the family