Ribbon chart in Power BI: rank per period, ties that do not flip, and what changed since last month
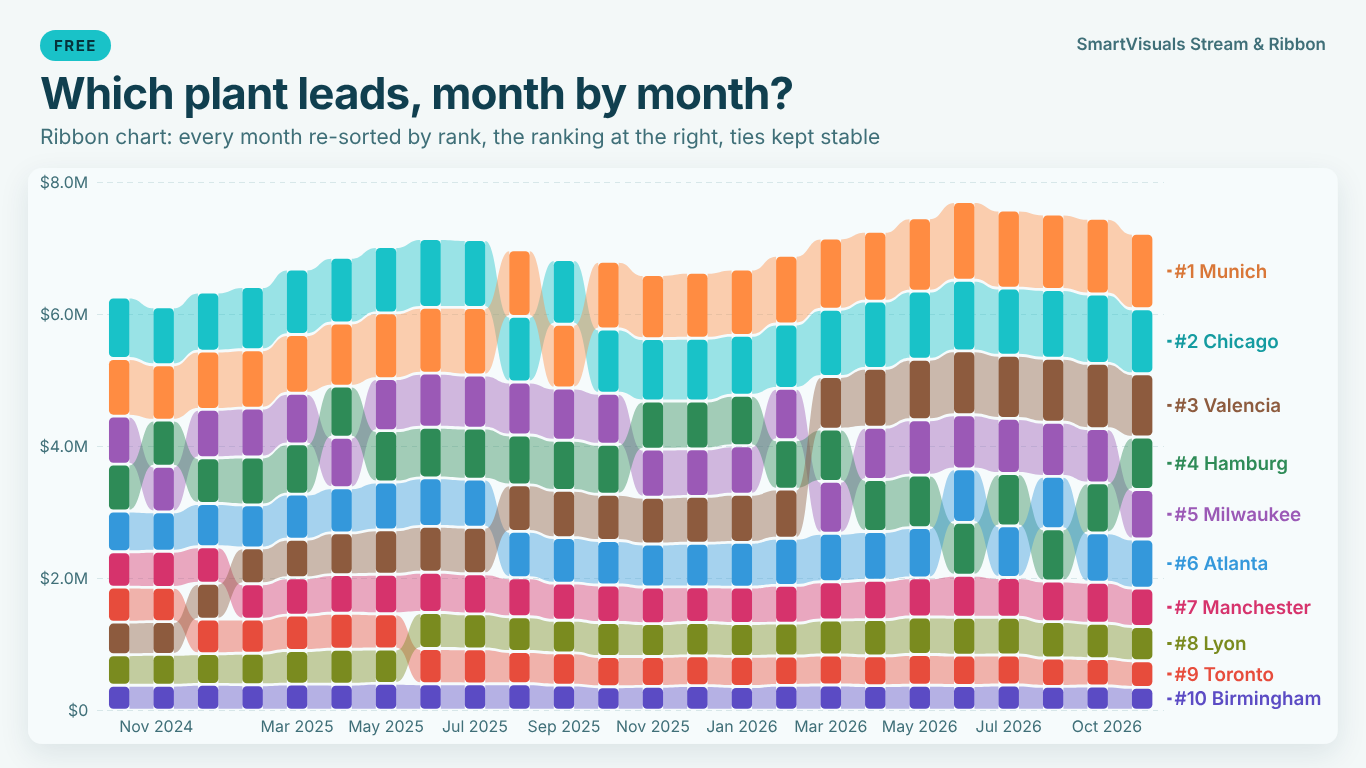
A ribbon chart is a stacked column chart with one twist: every period is re-sorted, so the biggest category sits on top of its column, and ribbons connect each category from one column to the next. When a ribbon crosses another, one category overtook the other. It answers "who leads, period by period?" faster than a line chart with ten crossing lines.
Everything in a ribbon chart depends on one number per category and period: its rank. That number is easy to compute and easy to get subtly wrong. This article builds the rank in DAX, shows where ties cause fake overtakes, and adds the measures that say what changed.
The data shape
A ribbon chart needs a period, a category and a value: Month, Plant and Revenue, one row per plant per month. The period should come from a date table, so that "previous month" and "same month last year" can be computed; text periods such as "2026-03" work for drawing but make every comparison harder.
| Month | Plant | Revenue |
|---|---|---|
| 2026-03-01 | Munich | 951,200 |
| 2026-03-01 | Chicago | 948,700 |
| 2026-03-01 | Hamburg | 812,400 |
| 2026-03-01 | Valencia | 812,400 |
The rank per period
The rank is computed per period over the categories in view. In a visual with Month on the axis, ALLSELECTED on the plant column keeps the month and any slicers and ranks the plants against each other:
Plant Rank =
IF (
    NOT ISBLANK ( [Revenue] ),
    RANKX ( ALLSELECTED ( Plants[Plant] ), [Revenue], , DESC, Skip )
)
The IF matters: without it a plant with no revenue in a month (a site that opened later) gets a rank anyway, below everyone, and a ribbon appears from nowhere.
Skip is the ranking a sports table uses. Hamburg and Valencia above both have 812,400; both are third, and the next plant is fifth. Dense would make the next one fourth. For a ribbon chart Skip is usually right, because the rank then also says how many categories are above: "fifth" means four plants did better.
Why two equal bands swap places
The rank tells you Hamburg and Valencia are both third. The chart still has to draw one of them above the other, and here the trouble starts. If nothing decides the order, it falls back on whatever order the rows arrived in, which can change with a filter, a refresh or a new plant in the data. In March Hamburg is drawn above Valencia, in April they are still tied but Valencia is on top. The ribbons cross. Every reader sees an overtake that did not happen.
Ties are rarer with revenue to the cent than with counts, but they are common in exactly the data people put in ribbon charts: units, tickets, headcount, survey scores, or any value rounded before it is ranked. They also become more likely the more categories you show.
A tie rule needs two properties:
- Equal values share the rank. They are equal, so the label and the tooltip say "#3 (tied)" for both.
- The drawing order depends only on things the reader can see, and it does not move unless the data moves.
The rule that satisfies both is to keep the previous period's order. Whoever was higher last month stays higher while the tie lasts; a category that had no rank last month comes after one that had; if that still does not decide, the name decides. Alphabetical order alone is stable, but it can create its own fake overtake: if Valencia was above Hamburg in March and they tie in April, alphabetical order suddenly puts Hamburg on top.
The tie rule in DAX
First the previous period's rank, then a drawing order that uses it to break ties:
Plant Rank PM =
CALCULATE ( [Plant Rank], DATEADD ( 'Date'[Date], -1, MONTH ) )

Draw Order =
VAR CurPlant = SELECTEDVALUE ( Plants[Plant] )
VAR CurValue = [Revenue]
VAR CurPrev  = COALESCE ( [Plant Rank PM], 9999 )
VAR InView =
    ADDCOLUMNS (
        ALLSELECTED ( Plants[Plant] ),
        "@Value", [Revenue],
        "@Prev", COALESCE ( [Plant Rank PM], 9999 )
    )
RETURN
    IF (
        NOT ISBLANK ( CurValue ),
        1 + COUNTROWS (
            FILTER (
                InView,
                NOT ISBLANK ( [@Value] )
                    && ( [@Value] > CurValue
                        || ( [@Value] = CurValue && [@Prev] < CurPrev )
                        || ( [@Value] = CurValue && [@Prev] = CurPrev && Plants[Plant] < CurPlant ) )
            )
        )
    )
Plant Rank is what you show; Draw Order is what you sort by. They are equal everywhere except inside a tie, where Draw Order gives each tied plant a distinct position. Use Draw Order to sort a table or matrix next to the chart, to check a chart, or in any visual that lets you set the order per period.
One more decision: if the chart shows revenue in thousands, should 812,400 and 812,450 be a tie? The reader sees "812K" twice. If the answer is yes, rank on ROUND ( [Revenue], -3 ); if no, keep the full value and accept that the chart will show two equal labels in a fixed order. Either is defensible; mixing them is not.
What changed since last month
A ribbon chart shows the ranking. The question in the meeting is usually what changed, and that is two more measures:
Rank Change =
VAR RankNow  = [Plant Rank]
VAR RankPrev = [Plant Rank PM]
RETURN IF ( NOT ISBLANK ( RankNow ) && NOT ISBLANK ( RankPrev ), RankPrev - RankNow )

Rank Change Label =
VAR Change = [Rank Change]
RETURN
    SWITCH ( TRUE (),
        ISBLANK ( Change ), "new",
        Change > 0, "▲" & Change,
        Change < 0, "▼" & ABS ( Change ),
        "="
    )
A positive change means the plant moved up. Put the label in the tooltip, or in the data labels of a table beside the chart. For a year-on-year view, replace DATEADD ( 'Date'[Date], -1, MONTH ) with SAMEPERIODLASTYEAR ( 'Date'[Date] ); for a budget comparison, rank the budget measure the same way and subtract.
Two cautions. A rank change says nothing about size: moving from fifth to fourth can mean 1,000 or 100,000 more revenue, so show the value change next to it. And the arrows must not rely on colour alone; the ▲ and ▼ already carry the direction, which is why they are better than a red and green dot.
Too many ribbons
Past eight or ten categories a ribbon chart becomes a tangle. The usual fix is Top N per period with the rest in one "Other" band. Do it per period, not over the whole range: a plant that is in the top five in March and sixth in April should leave the chart in April, and the chart should mark that exit, otherwise its ribbon just vanishes. A Plant Rank above N mapped to "Other" in a calculated grouping does the job, but remember that Other's own size then changes with every entry and exit.
A stream graph for the shares
When the question is the mix rather than the order (how did the share of Pumps, Valves and Bearings move?), the same data draws better as a stream graph: bands stacked around a centre line, smooth, with no re-sorting. Ribbons for ranks, streams for shares; the data shape is the same.
Doing it without the measures
The measures above are worth having in any model, if only to check a chart. Drawing them is where it gets fiddly. SmartVisuals Stream & Ribbon does both charts from Axis (period), Legend and Values: the ribbon chart re-sorted by rank every period, and a stream graph with wiggle, silhouette, 100 % and stacked layouts. Ties share the rank ("#2 (tied)") and keep the previous period's order, then name, set under Ranking > Tie Rule; the footnote can state the rule under the chart. Names, values, shares and ranks go inside the bands, sized by thickness and never overlapping, and End Labels can list the ranking at the right end. All of that is free, with no limit on the number of series, five style templates, typed events with shaded periods, a total line with a linear trend, a range navigator, keyboard navigation and 20 languages.
Premium ($1.99 per user per month or $19 per user per year) adds what changed in the ranking: change and rank change against the previous period, the same period last year or a Comparison field, with the old rank drawn as a ghost; Top N and Other per period with entries and exits marked; ranking by a second measure; risers and overtakes with a one-line callout; playback through the periods; small multiples; and a forecast of the total with prediction intervals. Ranks, shares and the stream layouts are tested against scipy, pandas and NumPy. The visual has been submitted to Microsoft Marketplace and is not published there yet; the product page will link to the listing once it is live.
If you build it yourself, the checklist is short: rank per period with Skip, leave blanks unranked, break ties with the previous period and then the name, decide whether rounded values tie, and show rank changes with arrows next to the value change.
Try AI Chatbot for Free
Experience the power of conversational analytics in your Power BI reports. Get your free license in seconds - no credit card required.
Get Free License