Stream & Ribbon

    Who leads, period by period, and what changed.

    A ribbon chart and a stream graph in one visual. Every period is ranked, ties follow a stated rule so equal bands never swap at random, and the names sit inside the bands, free with no series limit. Premium adds rank changes against last year, Top N per period, risers and overtakes, playback and a forecast of the total.

    Read the documentationComing soon to Microsoft Marketplace
    Datasheet
    Status
    Coming soon to Microsoft Marketplace
    Price
    $1.99 /user/mo · $19 /user/yr
    Licensing
    Per user, assigned in the Microsoft 365 admin center, with a 30-day free trial. Unlicensed viewers see the free tier, never a blocked visual.
    Data
    Computed inside Power BI. No external calls, no API keys, no telemetry.
    Visuals API
    5.11.0
    Accessibility
    Keyboard navigation (one tab stop), screen reader summary and labels, data table, high contrast, hatch patterns, reduce motion
    Languages
    20 languages: Chinese (simplified and traditional), Czech, Danish, Dutch, English, French, German, Hungarian, Italian, Japanese, Korean, Norwegian, Polish, Portuguese (Brazil and Portugal), Slovak, Spanish, Swedish and Turkish
    Chart types
    Ribbon chart; stream graph with wiggle, silhouette, 100 % and stacked layouts; vertical or horizontal
    Data volume
    30,000 rows per window, up to 150,000 rows; no series limit of our own
    Privacy
    No external calls, no privileges requested, no telemetry
    Works in
    Power BI Desktop, Service, Embedded
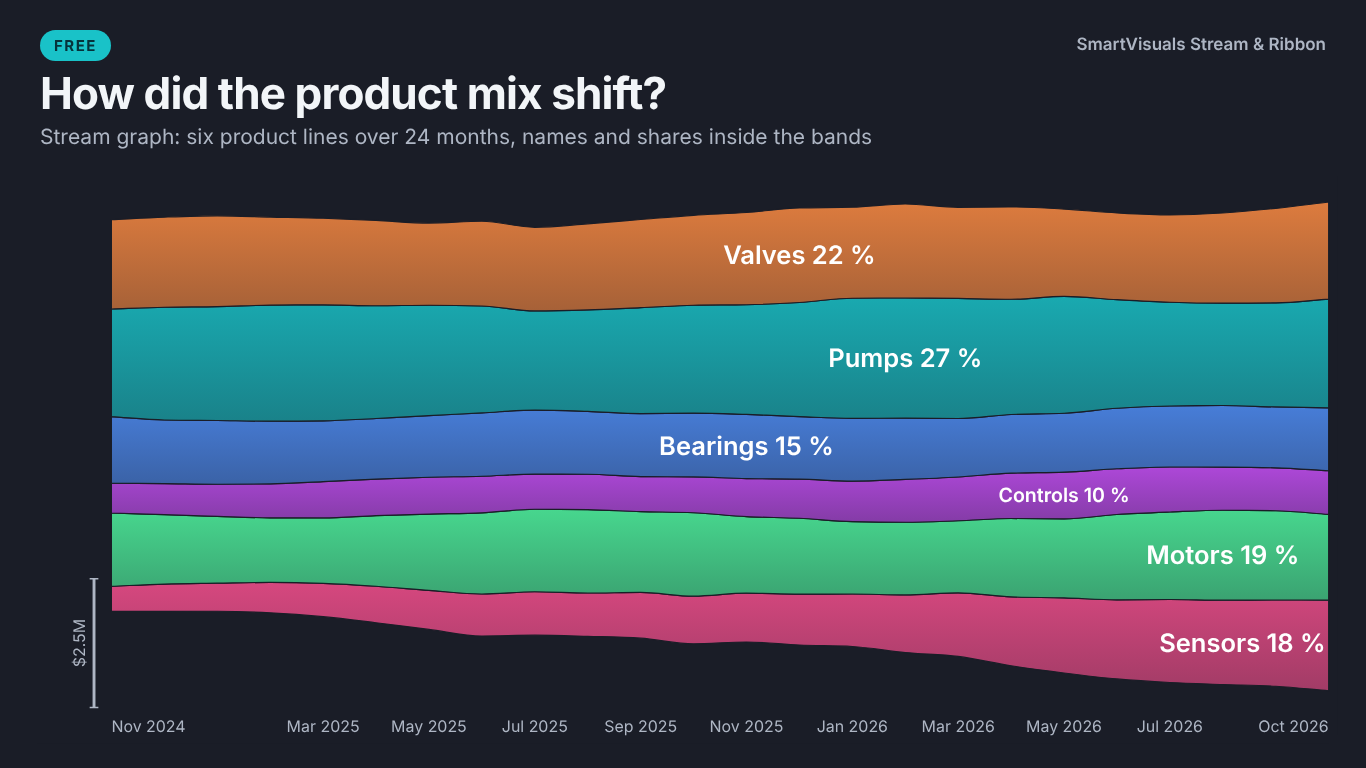
    Stream graph in Power BI on the Dark theme showing how the Helios product mix shifted month by month, with product line names and shares inside the bands
    Pl. XLVIII  ·  Stream & Ribbon  ·  Free: how the product mix shifted, as a stream graph with names and shares inside the bands (Dark theme).rendered from the shipped visual
    What it does

    SmartVisuals Stream & Ribbon draws a ribbon chart and a stream graph from a date, a category and a measure. The ribbon chart re-sorts every period by rank and connects each category across periods; the stream graph shows how the mix flows. Equal values share a rank and keep the previous period's order, then name, and the footnote can state that rule, so the drawing only moves when the data does.

    The free version has both charts with every layout, names, values, shares and ranks inside the bands, start and end labels, the tie rule, a legend in rank order, typed events with shaded periods, reference lines, a total line with a linear trend, a range navigator, five style templates, four themes, keyboard navigation and 20 languages, with no limit on series. Premium adds what changed in the ranking: rank change against a reference, Top N and Other per period, rank by a second measure, risers and overtakes, playback, small multiples and a forecast of the total. Every Premium feature previews in full while you edit, readers without a licence always see the free chart, and the visual makes no external calls.

    Free and premium

    Where the line is, exactly.

    Report authors see the full premium set in edit mode, so you can evaluate every feature on your own data before assigning a single licence. Unlicensed viewers always get a working chart.

    Free tierevery viewer
    • Ribbon chartEach period re-sorted by rank, largest on top or at the bottom, segment spacing, ribbon opacity, smooth or straight ribbons and ribbon borders.
    • Stream graphWiggle, silhouette, 100 % and stacked layouts, inside-out, largest-on-top, peak date, name or data order, and a size scale where an axis would mislead.
    • Ranks with a stated tie ruleEqual values share the rank and keep the previous period's order, then name; the footnote can state the rule.
    • Names inside the bandsName, value, share or rank inside each band, sized by thickness and never overlapping, plus start and end labels.
    • Legend in rank orderOrdered by last-period rank, total, name or data order, with a button that lets readers change the order.
    • Events and reference linesAnnotations from a field or typed in the pane, shaded until the next event, horizontal and vertical reference lines.
    • Total and trendA total line with a linear trend and total labels above the bands.
    • Zoom and range navigatorCtrl + wheel zooms, dragging pans, and a range navigator under the chart; periods spaced equally or by date.
    • Shapes and orientationVertical or horizontal; smooth, straight or step edges with a curvature slider; flat or gradient fills.
    • Colours your wayPower BI fx rules, Focus Colours to emphasise named series and grey the rest, colours by legend order or by name, or the report theme's palette.
    • Templates and four themesExecutive, IBCS, Minimal, Presentation and Print; SmartVisuals, Dark, Clean and Slate; animated data changes and a reveal animation.
    • Accessibility and 20 languagesKeyboard navigation, a screen reader summary, a data table with ranks, hatch patterns, high contrast and 20 languages.
    Premium$1.99 /user/mo · first month free
    • Rank change▲ and ▼ rank changes and Δ or Δ % against the previous period, the same period last year or a Comparison field, with the old rank as a ghost.
    • Top N and Other per periodEach period keeps its own top N, the rest in one Other band, with entries and exits marked.
    • Rank by a second measureThe thickness stays revenue while the order follows margin or growth.
    • Risers and overtakesThe biggest riser and faller highlighted, overtakes marked, and a one-line callout naming the most important one.
    • PlaybackStep through the periods with a play button or P, and watch the ranking re-sort live.
    • Small multiplesOne chart per region or business unit, on a shared scale by default.
    • Forecast of the totalExponential smoothing on the total with 80 % and 95 % prediction intervals.
    Getting started

    From empty canvas to first chart.

    1. 01

      Add SmartVisuals Stream & Ribbon to the page. The empty visual lists the fields still missing and offers to load a template.

    2. 02

      Drag a date or period to Axis (period), a category to Legend and a measure to Values. Without a Legend, two or more measures in Values become the series.

    3. 03

      Pick the chart under Chart > Chart Type: Ribbon chart or Stream graph (streamgraph), and the stream layout under Stream > Layout (Offset).

    4. 04

      Set labels under Labels Inside Bands and End Labels, the tie rule under Ranking, and a template under Style Template or a theme under Theme.

    5. 05

      Optional, Premium: choose Compare (What Changed) > Compare With, Top N and Other, Risers and Overtakes, Playback or Forecast of the Total, or bind Rank by (premium) or Small multiples. Everything previews in full while you edit.

    Get Stream & Ribbon

    On its way.

    Installation instructions for both paths are on the download page.

    Microsoft Marketplace (recommended)

    The offer is prepared for Microsoft Marketplace and not published yet. This page will link to the listing the moment it is live.

    Coming soon
    Documentation

    Everything else about Stream & Ribbon.

    The guide, use cases, questions and the full settings reference. Open what you need, or search.

    Search all visuals

    Stream & Ribbon in Power BI, explained

    6 short chapters: what the visual does and why

    Ribbon chart or stream graph: which one answers my question?

    Both draw categories over time from the same three fields: a date in Axis (period), a category in Legend and a measure in Values. A ribbon chart answers "who leads, period by period?": every period is a column re-sorted by rank, and ribbons connect each category from one column to the next, so a crossing is an overtake. A stream graph answers "how did the mix shift?": the bands flow around a centre line without re-sorting, and their thickness is the share.

    SmartVisuals Stream & Ribbon draws both, and Chart > Chart Type switches between them on the same data. The stream graph has four layouts under Stream > Layout (Offset): Wiggle (streamgraph), Silhouette (centred), 100 % (expand) and Stacked from zero. Where an axis would mislead, as on a wiggle layout, a size scale takes its place.

    Why do two equal bands swap places, and how is that prevented?

    When two categories have the same value in a period, one of them has to be drawn first. If nothing decides the order, the pair can swap from one month to the next with no change in the data, and readers see an overtake that never happened. Ties are common in units, tickets, headcount and any value that is rounded before it is ranked.

    Here equal values share the rank ("#2 (tied)", the next one is #4) and keep the previous period's order, then go by name. Ranking > Tie Rule can switch to Name (A to Z), and Footnote > State the Rank and Tie Rule writes the rule under the chart. The ranks are golden-tested against scipy's rankdata and the drawing order against a pandas sort on value, previous position and name.

    How do names, ranks and shares get onto the chart?

    Labels Inside Bands puts the name, value, share or rank inside each band, sized by its thickness and never overlapping; a label that does not fit is left out rather than drawn over its neighbour. Start Labels and End Labels name the bands at the edges, so End Labels with Rank and name lists the ranking at the right end (#1 Munich, #2 Chicago).

    The legend follows Ranking > Legend Order: rank in the last period, total over all periods, data order or name. With Let Readers Change the Order on, a small button inside the visual lets readers cycle through those orders themselves. Tooltips can add the share of the period, the rank with ties and the period total.

    What changed in the ranking since last year?

    That is Premium. Compare (What Changed) > Compare With sets the reference: the previous period, the same period last year from the data, or a Comparison field such as a prior-year or budget measure. Labels and tooltips then show the rank change (▲2, ▼1) and the change as Δ, Δ % or both, and the old rank can be drawn as a ghost.

    Top N and Other keeps the top N per period with the rest in one Other band and marks entries and exits. Rank by (premium) orders the bands by a second measure while the thickness stays the first, so the chart can be big by revenue and ranked by margin. Risers and Overtakes highlights the biggest riser and faller and writes a callout such as "Valencia overtook Hamburg in Mar 2026". Playback steps through the periods with a live ranking, Small multiples draws one chart per region, and Forecast of the Total adds 80 % and 95 % prediction intervals from exponential smoothing.

    How many categories and periods can it draw?

    There is no series limit of our own: Power BI sends up to 1,000 legend values, and colours do not repeat past the palette. The visual reads 30,000 rows per window and fetches up to 150,000; when Power BI sends less than the model has, an icon says only part of the data is shown. Negative values have no thickness in a stream or ribbon, so they are drawn as zero, keep their value in the tooltip and are mentioned in the footnote.

    The layout adapts to the visual's size: below 480 px wide or 300 px high the legend moves under the chart, below 320 x 200 the legend and y-axis drop and the x-axis keeps its first and last period, and below 160 x 100 only the bands remain. Chart > Orientation turns both charts horizontal, with time from top to bottom and room for long names.

    What do report readers without a licence see?

    Always the free chart of the same data: both chart types, every layout, labels, ranks, shares and the tie rule. The visual never blocks a report and never adds a watermark, and Power BI shows its own short licence note. An unconfigured visual uses no Premium feature, so it never raises that note.

    In edit mode every Premium feature renders in full, so you can try the comparison, Top N and playback on your own data before buying. Premium is $1.99 per user per month or $19 per user per year through Microsoft Marketplace, assigned per user in the Microsoft 365 admin center.

    Use cases

    Where Stream & Ribbon earns its place

    Which plant leads, month by month

    Finance has monthly revenue per plant: Month, Plant and Revenue for Chicago, Munich, Milwaukee, Hamburg, Valencia and five more. Month goes to Axis (period), Plant to Legend and Revenue to Values, with Chart > Chart Type set to Ribbon chart. Each month is a column re-sorted by rank, the ribbons show every overtake, and End Labels with Rank and name list the ranking at the right end (#1 Munich, #2 Chicago). Free.

    How the product mix shifted

    The product mix table has Month, Product Line (Pumps, Valves, Bearings, Motors, Controls, Sensors) and Revenue. With Chart Type set to Stream graph (streamgraph) and Stream > Layout (Offset) on Wiggle or 100 % (expand), Labels Inside Bands with Name and share puts each product line's name and share inside its band, sized by thickness and never overlapping. Free.

    Mark the strike and the new line

    The plant controller wants the events on the chart without a measure. Annotations > Events takes typed entries such as 2025-03: Line 4 opens; 2025-09: Strike, and Shade Until the Next Annotation shades each period up to the next entry. An Annotation field can supply the texts from the model instead. Free.

    What changed against last year

    Compare (What Changed) > Compare With set to Same period last year (from the data), or to The Comparison field with a Revenue PY measure in Comparison, adds the rank change (▲2, ▼1) and the change in % to labels and tooltips, with the old rank drawn as a ghost. Risers and Overtakes adds a callout such as "Valencia overtook Hamburg in Mar 2026". Premium.

    Big by revenue, ranked by margin

    Revenue stays in Values and Margin goes to Rank by (premium): the thickness of every band stays revenue while the order in each column follows margin. Top N and Other > Top N per Period keeps, say, the top 6 plants per month with the rest in one Other band, entries and exits marked. Premium.

    Tell the ranking as a story

    For a review meeting, Playback > Play Through the Periods (Premium) adds a play button: the columns fill in period by period and the ranking at the right edge re-sorts live. P plays and pauses from the keyboard, and Milliseconds per Period sets the pace.

    Questions

    12 questions asked before you did

    More questions? Write to us.

    Both charts are free, with every layout, labels, ranks, shares, the tie rule, events, reference lines, total and trend, zoom, templates, accessibility and 20 languages, and no limit on series. Premium adds what changed in the ranking (rank change against a reference, Top N and Other per period, rank by a second measure, risers and overtakes, playback, small multiples and the forecast of the total) for $1.99 per user per month or $19 per user per year through Microsoft Marketplace.

    SmartVisuals Stream & Ribbon has been submitted to Microsoft Marketplace and is not published yet. This page will link to the listing once it is live.

    Equal values share the rank (#2, #2, #4). By default the tied bands keep the previous period's order, then go by name; Ranking > Tie Rule can switch to Name (A to Z). Footnote > State the Rank and Tie Rule writes the rule under the chart, and tooltips say "#2 (tied)".

    On top by default. Ribbon > Largest Value > At the bottom turns the ribbon chart upside down; the stream graph has its own Stack Order, including inside-out (largest in the middle).

    The free chart of the same data, plus a short notice from Power BI. Never a watermark and never a blank visual. In edit mode every Premium feature renders in full.

    No. Everything, the forecast included, is computed inside the visual. It makes no external calls, requests no privileges and sends no telemetry.

    There is no limit of our own; Power BI sends up to 1,000 legend values. Colours do not repeat past the palette, and Top N and Other (Premium) keeps a long list readable.

    Exponential smoothing (ETS) on the total. The model with the lowest AICc is chosen and drawn with 80 % and 95 % prediction intervals, checked against statsmodels. It needs at least six periods and is not drawn on the 100 % stream layout, where the total is always 100 %.

    Yes: report page and modern tooltips, drilldown on the axis, fx colour rules and dynamic format strings, cross-filter and highlight, plus Focus Colours to emphasise named series.

    Yes. The chart is one tab stop. Left and Right move between periods, Up and Down between bands, Enter or Space filters the report (Ctrl+Enter adds), Esc clears, T shows a data table with ranks, [ and ] move the zoom window and + and - zoom. A screen reader hears a summary that names the leader, then each mark's period, value, share and rank.

    20: Chinese (simplified and traditional), Czech, Danish, Dutch, English, French, German, Hungarian, Italian, Japanese, Korean, Norwegian, Polish, Portuguese (Brazil and Portugal), Slovak, Spanish, Swedish and Turkish, for the format pane and everything drawn in the visual, also in Power BI Desktop.

    Post it on the public board at smartvisuals.io/feedback, where other users can vote and comment, or use the Report a bug block on the support page (smartvisuals.io/support) or email hello@smartvisuals.io. A screenshot and the fields you mapped help most; sample data is welcome but never required.

    Troubleshooting

    When it does not look right

    Found a bug or missing something? Post it on the requests board; the developer answers within two business days.

    The visual asks for a date or period on Axis.
    Axis (period) is empty. Add a date, a level of a date hierarchy, a number or text periods. With text periods the order comes from the data.
    It asks for a category on Legend or more measures on Values.
    A ranking needs at least two series. Add a category to Legend, or put two or more measures in Values without a Legend.
    A warning icon says only the first measure is drawn.
    With a Legend bound, Values uses its first measure. Move the second measure to Rank by (premium) to order the bands by it, or to Tooltips.
    Two bands show the same rank.
    Their values are equal, so both get the rank ("#2 (tied)") and the next one is #4. Ranking > Tie Rule decides which is drawn first: Keep the previous period's order, then name (the default) or Name (A to Z). Footnote > State the Rank and Tie Rule writes the rule under the chart.
    Negative values look like zero.
    A stream or ribbon has no sign, so a negative value is drawn with zero thickness and keeps its real value in the tooltip. The footnote says so.
    Same period last year does nothing.
    It needs a calendar axis (day, week, month, quarter or year) or an integer year column. On text periods, put a prior-year measure in Comparison and set Compare With to The Comparison field.
    The forecast of the total is missing.
    Forecast of the Total (Premium) needs at least six periods and is not drawn on the 100 % (expand) stream layout, where the total is always 100 %.
    A "Showing part of the data" icon appears.
    Power BI sent fewer rows than the model has: the visual reads 30,000 rows per window and fetches up to 150,000. Filter the date range or use a coarser period, such as months instead of days.
    The colours changed after a series was added.
    By default colours follow the legend order. Theme > Colour Order set to Name (stable when filtered) ties each colour to the series name instead, and a band keeps its colour when a slicer adds or removes series; Theme > Colours set to From the report theme uses the report's palette, and Series Colours pins a colour per series.
    There is no play button.
    Playback is Premium and needs at least three periods; it is hidden on visuals smaller than 480 x 300 px. Readers without a licence see the complete chart instead, and in edit mode it previews in full.
    Rank changes and Top N disappear for some readers.
    Those features are Premium and need a licence per reader, assigned in the Microsoft 365 admin center. Readers without one see the free chart of the same data and a short Power BI notice; the report is never blocked and nothing is watermarked.

    Accessibility

    Keyboard, screen readers and high contrast
    Tab
    Moves into the chart, which is one tab stop; the focused band segment gets a focus outline.
    Left / Right arrow
    Moves to the previous or next period.
    Up / Down arrow
    Moves to the band above or below in the same period.
    Enter or Space
    Selects the focused series and cross-filters the page. Ctrl+Enter adds it to the selection.
    Esc
    Clears the selection.
    T
    Shows or hides a data table of every value with its rank.
    [ / ]
    Moves the zoom window to earlier or later periods.
    + / -
    Zooms in or out on the periods.
    P
    Plays or pauses playback through the periods (Premium, when Playback is on).
    • Screen readers

      When the chart gets focus, a screen reader hears a summary such as "Ribbon chart of Revenue by Plant: 24 periods, 10 series. Munich led in 14 of 24 periods." Each mark is then read with its period, value, share and rank as the focus moves, through a polite live region.

    • Data table

      A table of every value with its rank is always present for screen readers, and T shows it on screen for everyone.

    • Not colour alone

      Accessibility > Distinguish Series Without Colour gives every band its own hatch pattern. Rank changes carry ▲ or ▼ and a sign, never colour alone, and ties are written as "#2 (tied)".

    • High contrast

      In Windows high contrast mode the visual uses the system colours, outlines the bands and draws the hatch patterns; the report theme palette is not used.

    • Reduced motion

      Accessibility > Reduce Motion, or the operating system's reduced-motion setting, turns off the animation on data changes (Theme > Animate Data Changes, on by default) and the reveal animation (off by default).

    • Focus outline and text size

      Accessibility > Focus Outline Colour and Focus Outline Width set the focus outline, and Minimum Text Size (0 = off) keeps every label at or above that size.

    • Context menu

      Right-clicking a band, empty space or the setup guide opens the Power BI context menu.

    • Languages

      The format pane and everything drawn in the visual (setup guide, tooltips, smart caption and footnote) are available in 20 languages, also in Power BI Desktop: Chinese (simplified and traditional), Czech, Danish, Dutch, English, French, German, Hungarian, Italian, Japanese, Korean, Norwegian, Polish, Portuguese (Brazil and Portugal), Slovak, Spanish, Swedish and Turkish.

    Missing something?

    Tell us what is missing.

    A feature you need, a bug you hit, a visual that does not exist yet. Every message reaches the person who builds these visuals, and feature requests shape what ships next. We also build visuals to order.

    Also in the family