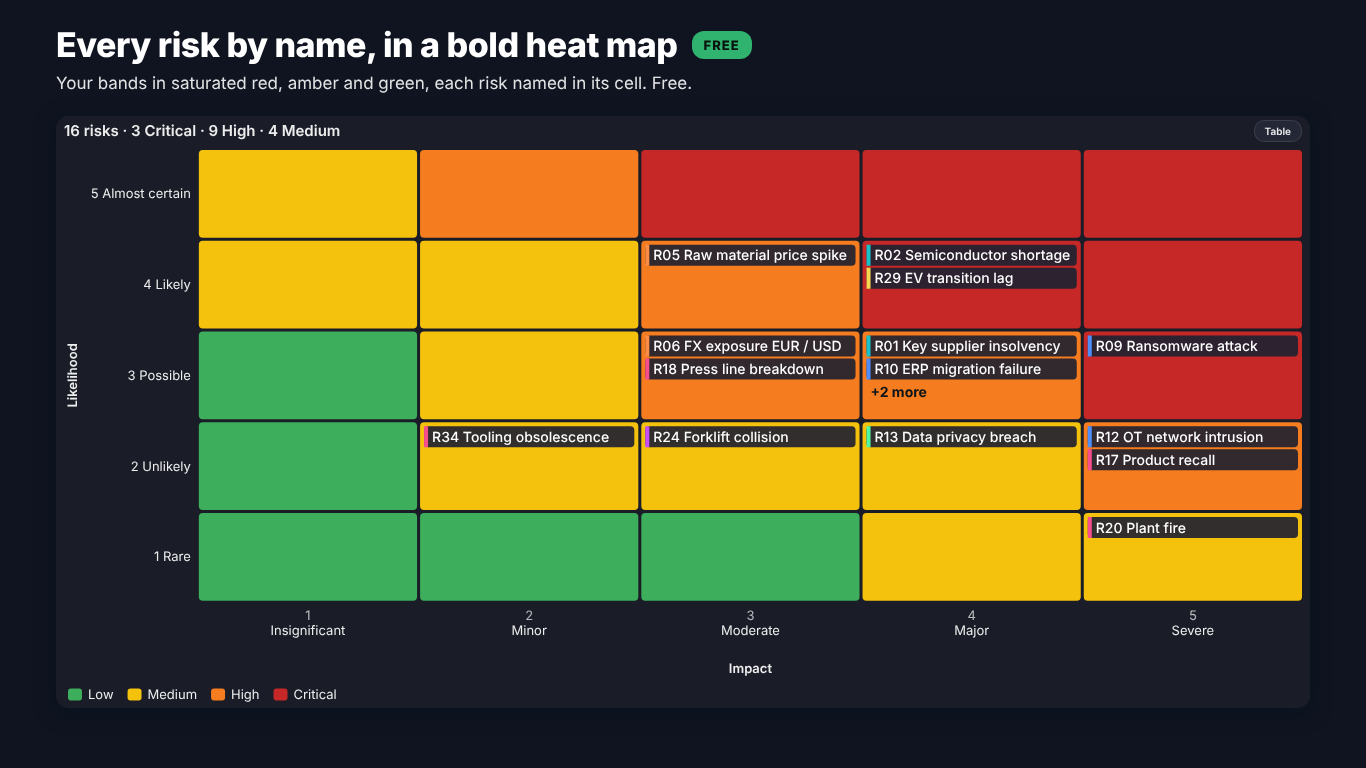
Risk matrix in Power BI: a likelihood × impact heat map with DAX, your own bands and the latest review
A risk matrix puts every risk on a grid of likelihood by impact and colours the cells by how serious that combination is. It is the page a risk committee opens first, because it answers "how bad is it overall?" in a few seconds. It is also the chart that most often gets rebuilt by hand in PowerPoint every quarter, because the register lives in Excel or SharePoint and Power BI has no risk matrix of its own.
You can build one with the native matrix visual and a few measures. This article does that step by step, and then goes through the four decisions that decide whether the result can be trusted: how cells become bands, which review is drawn, what happens to blank or out-of-scale values, and what the grid hides when two risks share a cell.
The register and the grid
Start from the register as it usually arrives: one row per risk and review.
| Review | RiskID | Risk | Category | ResidualLikelihood | ResidualImpact | Exposure |
|---|---|---|---|---|---|---|
| 2026 Q3 | R01 | Key supplier insolvency | Supply chain | 3 | 4 | 4,116,000 |
| 2026 Q3 | R02 | Semiconductor shortage | Supply chain | 4 | 4 | 3,150,000 |
| 2026 Q3 | R05 | Raw material price spike | Financial | 5 | 3 | 2,650,000 |
The matrix needs every cell, including the empty ones, so the axes cannot come from the register: a level that no risk has today would simply be missing. Create two small disconnected tables instead, one per axis, with the level and its name:
Likelihood =
DATATABLE (
    "Level", INTEGER, "Likelihood", STRING,
    { { 1, "Rare" }, { 2, "Unlikely" }, { 3, "Possible" }, { 4, "Likely" }, { 5, "Almost certain" } }
)

Impact =
DATATABLE (
    "Level", INTEGER, "Impact", STRING,
    { { 1, "Insignificant" }, { 2, "Minor" }, { 3, "Moderate" }, { 4, "Major" }, { 5, "Severe" } }
)
Sort each name column by its Level column. Put Likelihood[Likelihood] on the rows of a matrix visual, sorted descending so the most likely row is at the top, and Impact[Impact] on the columns. Leave both tables unrelated to the register.
Counting risks per cell
The cell measure reads the level of the row and the column and counts the risks that sit there in the latest review:
Risks in Cell =
VAR L = SELECTEDVALUE ( Likelihood[Level] )
VAR I = SELECTEDVALUE ( Impact[Level] )
VAR LastReview = MAX ( Register[Review] )
RETURN
    CALCULATE (
        COUNTROWS ( Register ),
        Register[ResidualLikelihood] = L,
        Register[ResidualImpact] = I,
        Register[Review] = LastReview
    ) + 0
The + 0 at the end matters. Without it an empty cell returns blank, the matrix drops rows and columns that have no risk at all, and the grid loses its shape. With it every cell exists, shows 0 and can be coloured.
MAX ( Register[Review] ) works on text as long as the periods sort as text ("2026 Q1" before "2026 Q3"). It respects slicers, so a Review slicer replays an older quarter. If your periods are dates or "Q3 2026", sort by a proper date column instead.
A count alone hides the names the committee asks for. A second measure lists the IDs for the tooltip or for the cell itself:
Risk IDs in Cell =
VAR L = SELECTEDVALUE ( Likelihood[Level] )
VAR I = SELECTEDVALUE ( Impact[Level] )
VAR LastReview = MAX ( Register[Review] )
RETURN
    CONCATENATEX (
        FILTER (
            Register,
            Register[ResidualLikelihood] = L
                && Register[ResidualImpact] = I
                && Register[Review] = LastReview
        ),
        Register[RiskID], ", ", Register[RiskID], ASC
    )
From a cell to a band
Most policies score a cell as likelihood times impact and cut the score into bands. On a 5 x 5 grid a common cut is 1 to 3 Low, 4 to 8 Medium, 9 to 12 High and 15 to 25 Critical:
Cell Band =
VAR Score = SELECTEDVALUE ( Likelihood[Level] ) * SELECTEDVALUE ( Impact[Level] )
RETURN
    SWITCH ( TRUE (),
        Score >= 15, "Critical",
        Score >= 9,  "High",
        Score >= 4,  "Medium",
        "Low"
    )

Cell Colour =
SWITCH ( [Cell Band],
    "Critical", "#C62828",
    "High",     "#F57C00",
    "Medium",   "#F9C80E",
    "#43A047"
)
In the matrix, open Cell elements for Risks in Cell, switch on Background colour, choose Field value and pick Cell Colour. Because the band depends only on the cell, the cells with 0 risks are coloured too, which is what a risk matrix should look like.
When 5 x 1 is not 1 x 5
Multiplying levels has a known weakness: the levels are ranks, not quantities. A rare but severe risk (likelihood 1, impact 5) scores 5, exactly like a frequent nuisance (5 x 1), and 2 x 2 ties with 1 x 4. Many risk policies say so explicitly and rank the severe end higher. If yours does, do not bend the thresholds until the picture looks right. Type the policy table in as it is written:
Band Table =
DATATABLE (
    "Likelihood", INTEGER, "Impact", INTEGER, "Band", STRING,
    {
        { 5, 1, "Medium" }, { 5, 2, "High" },   { 5, 3, "Critical" }, { 5, 4, "Critical" }, { 5, 5, "Critical" },
        { 4, 1, "Low" },    { 4, 2, "Medium" }, { 4, 3, "High" },     { 4, 4, "Critical" }, { 4, 5, "Critical" },
        { 3, 1, "Low" },    { 3, 2, "Medium" }, { 3, 3, "High" },     { 3, 4, "High" },     { 3, 5, "Critical" },
        { 2, 1, "Low" },    { 2, 2, "Low" },    { 2, 3, "Medium" },   { 2, 4, "High" },     { 2, 5, "High" },
        { 1, 1, "Low" },    { 1, 2, "Low" },    { 1, 3, "Medium" },   { 1, 4, "Medium" },   { 1, 5, "High" }
    }
)

Cell Band =
LOOKUPVALUE (
    'Band Table'[Band],
    'Band Table'[Likelihood], SELECTEDVALUE ( Likelihood[Level] ),
    'Band Table'[Impact], SELECTEDVALUE ( Impact[Level] )
)
Twenty-five rows are easier to audit than a SWITCH with tuned thresholds, and the risk office can check them against the policy line by line.
Which review is drawn
A register with history has the same risk once per quarter. A matrix built on the whole table counts R01 three times and draws it in three cells. The LastReview variable above fixes that, but watch two traps:
- Closed risks. A risk closed in Q3 has no Q3 row, so it disappears from the matrix. That is correct, but the committee will ask where it went. Count closed risks separately by comparing the last two reviews.
- A risk not yet reassessed. If R14 has no Q3 row because nobody updated it, it also disappears, and the matrix looks better than it is. A card with the number of risks in the previous review but not in the latest one makes the gap visible.
Blank and out-of-scale values
Two kinds of rows silently fall out of the measures above. A risk with a blank likelihood or impact matches no cell. A risk with a 6 on a 5-level scale (a typo, or a unit that moved to a 6-point scale) matches no cell either. Neither shows up anywhere, and the total on the matrix no longer equals the number of risks in the register.
Add a check measure and put it in the title or a card under the matrix:
Risks Not Drawn =
VAR LastReview = MAX ( Register[Review] )
RETURN
    CALCULATE (
        COUNTROWS ( Register ),
        Register[Review] = LastReview,
        OR (
            ISBLANK ( Register[ResidualLikelihood] ) || ISBLANK ( Register[ResidualImpact] ),
            Register[ResidualLikelihood] > 5 || Register[ResidualImpact] > 5
        )
    )
If likelihood is a probability (0.35) rather than a level, bin it explicitly with your own cut points and decide what happens on a boundary: is 0.2 Rare or Unlikely? Write the rule down; a reader cannot see it in the colours.
Two risks in one cell are not the same risk
This is the criticism risk matrices deserve. Key supplier insolvency and a minor IT outage can share the Possible x Major cell while one could cost ten times as much as the other. The colour says they are equal. Three things help:
- Show the names, not only counts. The
Risk IDs in Cellmeasure in the cell or tooltip lets the reader see who is in there. - Add the money. If the register has an exposure estimate, a measure with the exposure per cell (
SUMXover the same filter) breaks the tie, and a footnote saying "same cell does not mean the same risk" keeps the chart honest. - Show movement. The useful committee question is not "where are we?" but "what moved since last quarter?". Comparing each risk's cell in the last two reviews, and listing the risks that went up a band, is more useful than any colour.
When the native matrix runs out
The recipe above gets you a correct heat map of counts. It starts to strain when the committee wants every risk on the grid as a marker, inherent and residual positions with arrows between them, an appetite line per category, trails since the last review, or the register of a clicked cell next to the grid.
That is what we built SmartVisuals Risk Matrix for. Risk, Likelihood and Impact give a matrix from 3 x 3 to 10 x 10 with every risk as a marker, packed so none hides another, or by name in its cell. Likelihood and impact can be levels, probabilities or percent with your own cut points; bands come from your thresholds or from a per-cell table typed into Scoring and Bands > Per-Cell Table, so 5 x 1 does not have to equal 1 x 5. With Review period bound only the latest review is drawn, and a data note counts every risk without a likelihood or an impact and every value placed on the nearest level.
All of that is free, with counts mode, cell notes, drill-through, templates, keyboard navigation, a data table and 20 languages. Premium ($2.99 per user per month or $29 per user per year, with volume plans for 100+ and 500+ users) adds the risk-committee review: inherent, residual and target positions with arrows, appetite and tolerance per category, what changed since the last review with a review picker, exposure in money per cell and band, a register panel, small multiples and opportunities on their own grid. The visual has been submitted to Microsoft Marketplace and is not published there yet; the product page will link to the listing once it is live.
If you stay with the native matrix, the checklist is short: build the axes from their own tables, draw only the latest review, type the band table from the policy instead of tuning thresholds, count the risks that were not drawn, and give the reader the names and the money behind every cell.
Try AI Chatbot for Free
Experience the power of conversational analytics in your Power BI reports. Get your free license in seconds - no credit card required.
Get Free License