Risk Matrix

    Your bands, every risk by name, and the committee review.

    A risk matrix and risk heat map that matches your methodology for free: 3 x 3 to 10 x 10, your thresholds or a per-cell band table, every risk on the grid without overlap. Premium adds residual and target, appetite per category, what changed since the last review and exposure in money.

    Read the documentationComing soon to Microsoft Marketplace
    Datasheet
    Status
    Coming soon to Microsoft Marketplace
    Price
    $2.99 /user/mo · $29 /user/yr
    Licensing
    Per user, assigned in the Microsoft 365 admin center, with a 30-day free trial. Unlicensed viewers see the free tier, never a blocked visual.
    Data
    Computed inside Power BI. No external calls, no API keys, no telemetry.
    Visuals API
    5.11.0
    Accessibility
    Keyboard navigation (one tab stop), screen reader labels and summary, sortable data table, high contrast with band patterns, minimum text size
    Languages
    20 languages: Chinese (simplified and traditional), Czech, Danish, Dutch, English, French, German, Hungarian, Italian, Japanese, Korean, Norwegian, Polish, Portuguese (Brazil and Portugal), Slovak, Spanish, Swedish and Turkish
    Grid
    3 x 3 to 10 x 10, rectangular allowed; 3 to 10 bands; levels, probabilities (0 to 1) or percent
    Data volume
    10,000 rows per window, up to 30,000 rows
    Privacy
    No external calls, no privileges requested
    Works in
    Power BI Desktop, Service, Embedded
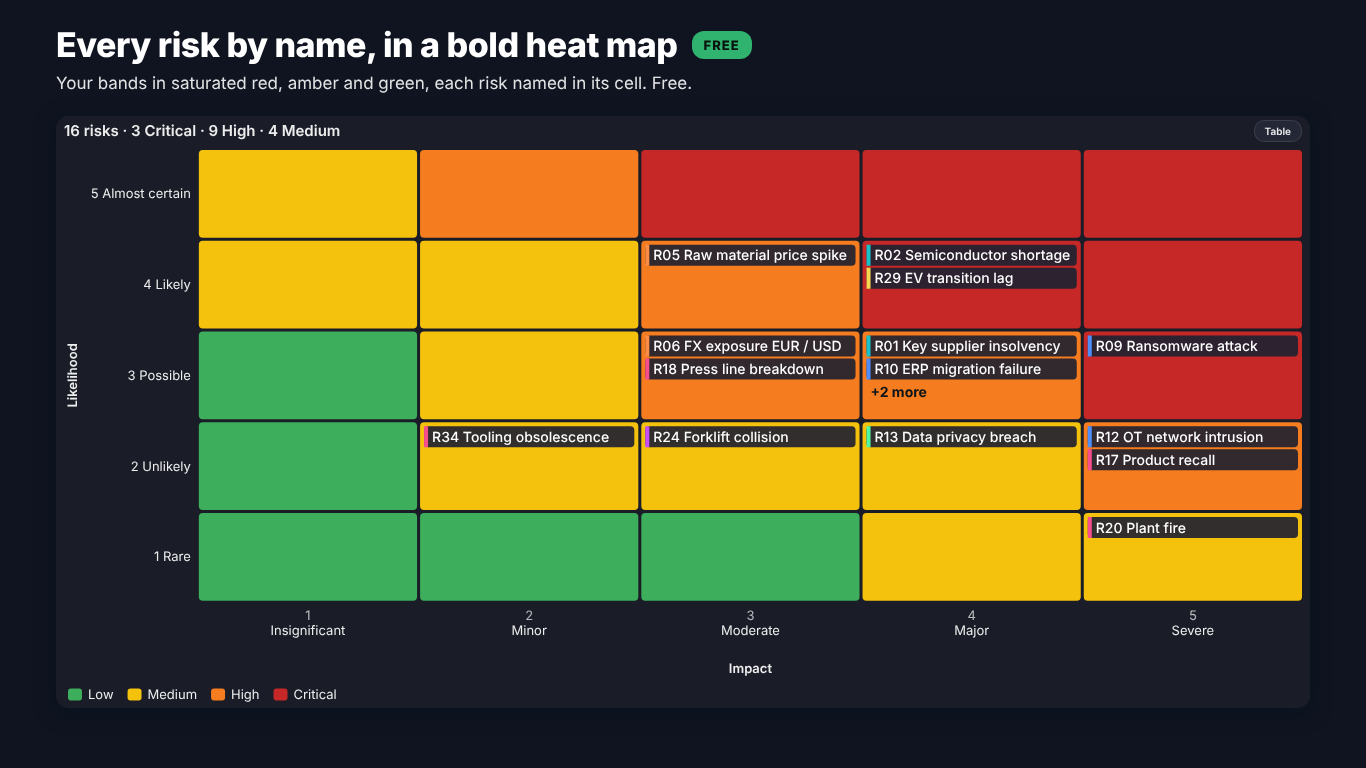
    Risk matrix in Power BI on the Dark theme with the Bold heat palette: red, amber and green bands with each Helios risk named in its cell
    Pl. XLVI  ·  Risk Matrix  ·  Free: every risk by name in a bold heat map (Dark theme, Bold heat palette).rendered from the shipped visual
    What it does

    SmartVisuals Risk Matrix draws a risk register the way a risk committee reads it: likelihood by impact on the bands of your own methodology, with every risk on the grid by ID or by name. Bind Risk, Likelihood and Impact and the matrix is there; bind Review period and only the latest review is drawn, with a data note for every risk that could not be placed.

    The free version is a complete risk matrix: grids from 3 x 3 to 10 x 10, levels, probabilities or percent, 3 to 10 bands with your thresholds or an asymmetric band table, packed markers, names in the cells, cell notes, counts mode, drill-through, templates, keyboard navigation, a data table and 20 languages. Premium adds the risk-committee review: inherent, residual and target with arrows, appetite and tolerance per category, since last review, exposure, a register panel, small multiples and opportunities. Every Premium layer previews in full while you edit, readers without a licence always see the free matrix, and the visual makes no external calls.

    Free and premium

    Where the line is, exactly.

    Report authors see the full premium set in edit mode, so you can evaluate every feature on your own data before assigning a single licence. Unlicensed viewers always get a working chart.

    Free tierevery viewer
    • Any risk matrix from 3 x 3 to 10 x 10 cellsSquare or rectangular grids, likelihood on rows or columns, level names you can rename, cell scores and grid lines.
    • Levels, probabilities or percentDetected automatically, with your own cut points; a value on a cut point belongs to the upper level.
    • Your bands3 to 10 bands from automatic or custom thresholds, scored as likelihood times impact, likelihood plus impact or a score table.
    • Asymmetric band tablesPaste the matrix from your policy, one line per likelihood level, so 5 x 1 does not have to equal 1 x 5.
    • Every risk visibleMarkers with risk IDs, packed so none hides another, a +n badge when a cell is full, or risk names in the cells.
    • Counts mode and cell notesA risk heat map of counts for dense registers, and custom annotations per cell such as "5,5: Escalate to the board".
    • Latest review and data notesWith a Review period, the latest review is drawn. Blank and out-of-scale values are counted, never silently dropped.
    • Cross-filter, drill-through, drilldownSelect by risk, cell or category, drill through from a cell, drill down a Category hierarchy, report page tooltips.
    • Conditional formatting both waysPower BI fx rules on a Colour value measure and the visual's own band colours, plus dynamic format strings and on-object formatting.
    • Templates and four themesExecutive, Board pack (print), Minimal, Heat map (counts) and Operations (dark); SmartVisuals, Dark, Clean and Slate; a calm theme ramp or a bold red, amber and green heat.
    • Setup guide with an exampleThe empty visual names the missing fields, offers template buttons and draws a built-in Helios register on request.
    • Accessibility and 20 languagesKeyboard navigation of every cell and risk, screen reader labels, band patterns, a sortable data table and 20 languages.
    Premium$2.99 /user/mo · first month free
    • Inherent, residual, targetArrows between the three positions, the other positions as ghosts, rings on risks still above target, and a switch for readers.
    • Appetite and tolerance per categoryAn appetite line per category, the tolerance band shaded and a ring on every breach, counted in the summary line.
    • Since last reviewTrails over past reviews, new, closed, escalated and de-escalated badges, the change of count per cell and a review picker.
    • Exposure in moneyMarker size by exposure, totals per cell and per band, an exposure heat map and the exposure above appetite.
    • Register panelThe clicked cell's risks in a sortable panel docked beside or under the matrix, with their movement and register columns.
    • Small multiplesOne matrix per business unit or category, on shared bands so a High means the same in every panel.
    • OpportunitiesThreats and opportunities side by side, opportunities on their own mirrored grid with upside bands.
    Getting started

    From empty canvas to first chart.

    1. 01

      Add SmartVisuals Risk Matrix to the page. The empty visual shows a setup guide with the missing fields, template buttons and See an example.

    2. 02

      Drag the risk name to Risk (and a short code to Risk ID), then the Likelihood and Impact measures. Add Category, Owner and Review period if you have them.

    3. 03

      Check the summary line and the data notes: they count risks without a likelihood or an impact and values placed on the nearest level. Set Matrix > Likelihood Levels and Impact Levels, or the cut points for probabilities, to match your scale.

    4. 04

      Set your bands under Scoring and Bands: number of bands, thresholds or a Per-Cell Table. Pick a template under Style Templates or a theme under Theme.

    5. 05

      Optional, Premium: bind Residual likelihood and Residual impact, Target likelihood and Target impact, Appetite, Exposure or Small multiples, or switch on Since Last Review or the Register Panel. Everything previews in full while you edit.

    Get Risk Matrix

    On its way.

    Installation instructions for both paths are on the download page.

    Microsoft Marketplace (recommended)

    The offer is prepared for Microsoft Marketplace and not published yet. This page will link to the listing the moment it is live.

    Coming soon
    Documentation

    Everything else about Risk Matrix.

    The guide, use cases, questions and the full settings reference. Open what you need, or search.

    Search all visuals

    Risk Matrix in Power BI, explained

    6 short chapters: what the visual does and why

    How do I build a risk matrix or risk heat map in Power BI?

    Power BI has no risk matrix of its own. The usual workaround is a matrix visual on two disconnected axis tables with a counting measure and conditional formatting, which gives a heat map of counts but no risk names, no markers and no movement. SmartVisuals Risk Matrix takes the register as it is: Risk (and optionally Risk ID), a Likelihood measure and an Impact measure draw the grid, every empty cell included, with each risk as a marker labelled with its ID.

    Grids run from 3 x 3 to 10 x 10, square or rectangular (5 x 4, 6 x 5, 5 x 10), with likelihood on the rows or the columns. Likelihood and impact can be levels, probabilities from 0 to 1 or percent, detected automatically, with your own cut points under Matrix > Likelihood Cut Points and Impact Cut Points. Level names such as Rare, Unlikely, Possible, Likely and Almost certain come preset and can be renamed under Likelihood Axis and Impact Axis.

    Can it follow our methodology, where 5 x 1 is not 1 x 5?

    Yes, and it is free. Scoring and Bands sets the score as likelihood times impact, likelihood plus impact or a per-cell score table, and 3 to 10 bands with automatic thresholds or your own. For an asymmetric policy, paste the matrix into Per-Cell Table: one line per likelihood level, highest first, one band name per impact level. Band names may contain spaces when the cells are separated by commas, and a data note says exactly what is wrong if a line does not fit.

    The band logic is golden-tested against an independent pandas reference: level binning, scores, automatic and custom thresholds, asymmetric band tables with multi-word names, and a published 5 x 5 healthcare risk matrix typed in by hand both as thresholds and as a band table.

    What happens when many risks share a cell?

    Markers are packed in a near-square block so no risk hides another. When a cell runs out of room the markers shrink to 70 % before the last slot becomes a +n badge, and the badge's tooltip and click cover the hidden risks. Markers > Show Risks As can also put the names in the cells (a chip per risk with its category colour, ID and name), draw counts as a risk heat map, or stay on Auto, which switches to counts when the busiest cell would hide most of its risks.

    Two risks in one cell are not the same risk, and the visual says so. Order in a Cell sorts by score, name or exposure, and with Exposure (Premium) bound the footnote states that the same cell does not mean the same risk while marker size and totals per cell show the money behind each one.

    How do residual and target positions, appetite and the last review show?

    These layers are the risk-committee review, and they are Premium. Bind Residual likelihood and Residual impact, Target likelihood and Target impact, and arrows run from inherent to residual to target, with a dashed ring on every risk still above its target. Readers can move the markers between the three positions with buttons above the matrix (Residual and Target > Reader Switch).

    Appetite and Tolerance measures, or one score for all categories under Risk Appetite, draw an appetite line per category, shade the tolerance band and ring every breach. With Review period bound, Since Last Review adds trails over past reviews, new, closed, escalated and de-escalated badges, the change of count per cell and a review picker that replays any of the last six reviews. Exposure sizes the markers and totals the money per cell and band, the Register Panel lists the clicked cell's risks, Small multiples draws one matrix per business unit on shared bands, and Threat / opportunity puts opportunities on their own mirrored grid.

    What does it expect from the register, and how much can it draw?

    One row per risk, or one row per risk and review. With a Review period field the latest review in the data is the current register, so the matrix is right without a filter; periods sort as dates, numbers or naturally as text (2026 Q2 before 2026 Q10). Risks with a blank likelihood or impact are not drawn and are counted in a data note, and values outside the scale are placed on the nearest level and counted too. The summary line above the grid reads like "40 risks, 5 Critical, 19 High".

    The visual reads 10,000 rows per window and fetches up to 30,000. It adapts to its size: below 480 px wide the legend and register panel move under the matrix, below 320 x 240 the axes show level numbers instead of names, and below 160 x 120 it draws a counts heat map only. Nothing is clipped.

    What do report readers without a licence see?

    Always the free risk matrix of the same data. The visual never blocks a report and never adds a watermark: without a licence, readers see the latest positions on your bands, with names, counts and drill-through, and Power BI shows its own short licence note once. An unconfigured visual uses no Premium feature, so it never raises that note.

    In edit mode every Premium layer renders in full, so you can build the committee pack on your own register before buying. Premium is $2.99 per user per month or $29 per user per year through Microsoft Marketplace, assigned per user in the Microsoft 365 admin center, with volume plans for 100+ and 500+ users.

    Use cases

    Where Risk Matrix earns its place

    The quarterly risk committee pack

    The risk office keeps the Helios register with one row per risk and review: Review, RiskID, Risk, Category, Owner, the inherent, residual and target likelihood and impact, Exposure, Appetite and Tolerance. Risk, Risk ID, Likelihood and Impact draw the free matrix of the latest review; Residual likelihood, Residual impact, Target likelihood, Target impact, Appetite and Exposure (Premium) add the arrows, the appetite line per category and the money per cell. Clicking a cell fills the Register Panel (Premium) with its risks, their movement and Status.

    A register kept in Excel or SharePoint, with history

    Each quarter the register gets a new block of rows with the same Risk ID and a new Review value (2026 Q1, 2026 Q2, 2026 Q3). With Review period bound, the visual draws only the latest review, so the matrix is right without a filter. Since Last Review (Premium) uses the earlier rows: trails, new, closed, escalated and de-escalated badges, the change of count per cell and a review picker that replays any of the last six reviews.

    An asymmetric methodology from the risk policy

    The Helios policy ranks a rare but severe risk above a frequent nuisance, so 5 x 1 is not 1 x 5. Instead of forcing likelihood times impact, the policy table is pasted into Scoring and Bands > Per-Cell Table: one line per likelihood level, highest first, one band name per impact level. Band names may contain spaces when the cells are separated by commas. It is free, and a note says what is wrong if a line is short.

    Project threats and opportunities

    A plant project in Toronto keeps threats and opportunities in one table with a Type column. Bound to Threat / opportunity (Premium), the opportunities get their own mirrored grid next to the threats, with upside bands and their own band names under Opportunities > Band Names. Exposure (Premium) sizes the markers so two risks in the same cell no longer look equal.

    Business units side by side

    The group risk manager compares Chicago HQ, Hamburg, Valencia and Toronto. The Unit column goes to Small multiples (Premium): one matrix per unit on the same bands, so a High in Hamburg means the same as a High in Valencia. Small Multiples > Columns sets the grid of panels.

    From a cell to the detail page

    Internal audit wants the controls behind every Critical cell. A drill-through page on Risk shows the controls and actions; right-clicking a cell or a marker on the matrix opens it. Category is also a drilldown role, so a hierarchy such as Category and sub-category steps down one level at a time. All of this is free.

    Questions

    12 questions asked before you did

    More questions? Write to us.

    The risk matrix is free with no time limit: grids from 3 x 3 to 10 x 10, levels, probabilities or percent, 3 to 10 bands with your thresholds or an asymmetric band table, packed markers, names in the cells, cell notes, counts mode, drill-through, templates, accessibility and 20 languages. Premium adds the risk-committee review (residual and target, appetite and tolerance, since last review, exposure, register panel, small multiples and opportunities) for $2.99 per user per month or $29 per user per year through Microsoft Marketplace, with volume plans for 100+ and 500+ users.

    SmartVisuals Risk Matrix has been submitted to Microsoft Marketplace and is not published yet. This page will link to the listing once it is live.

    Any grid from 3 x 3 to 10 x 10, rectangular allowed (5 x 4, 6 x 5, 5 x 10), with likelihood on the rows or the columns, and 3 to 10 bands. Matrix > Likelihood Levels and Impact Levels set the size; 0 means automatic, which opens 5 levels or more when the data go higher.

    Yes. Likelihood and impact can be levels (1, 2, 3 and so on), probabilities from 0 to 1 or percent, detected automatically or set under Matrix > Likelihood Values Are and Impact Values Are. Type your own cut points, one fewer than the levels and in the unit of the data; a value exactly on a cut point belongs to the upper level.

    Yes, in the free version. Scoring and Bands > Per-Cell Table takes your matrix as written: one line per likelihood level, highest first, one value per impact level from low to high. Values can be band names, their unique first letters, B1 to Bn, or scores (thresholds then apply). Separate the cells with commas when band names contain spaces.

    The free risk matrix of the same data, never a blocked or watermarked visual: the latest positions on your bands, names, counts and drill-through, without the arrows, appetite lines, review changes, exposure, register panel, small multiples and opportunities grid. Power BI shows its own short licence note once. In edit mode every Premium layer renders in full.

    No. Every number is computed inside the visual. It makes no external calls, requests no privileges and loads no remote images or fonts.

    Risk (or Risk ID) and two measures, Likelihood and Impact. Optional: Risk ID for the marker text, Category for colours, shapes, legend and drilldown, Owner, Review period, up to five Register columns, a Colour value measure for fx rules and up to ten Tooltips. The Premium wells are Residual likelihood, Residual impact, Target likelihood, Target impact, Exposure, Appetite, Tolerance, Threat / opportunity and Small multiples.

    Bind Review period and keep one row per risk and review. The latest review is drawn (free). With Since Last Review (Premium) on, the visual compares the last two reviews: new, closed, escalated and de-escalated risks get badges, trails show the last reviews, each cell shows its change of count, and the review picker replays the register as of any of the last six reviews.

    Yes. The visual is one tab stop. Arrow keys move between cells, Home and End jump to the first and last cell, the full stop and comma (or Page Down and Page Up) walk the risks of the focused cell, Enter or Space selects (Ctrl adds), Esc leaves the cell and then clears the selection, Shift+F10 opens the context menu and T switches to the data table. Every cell and risk has a screen reader label and a live region announces the focus.

    20: Chinese (simplified and traditional), Czech, Danish, Dutch, English, French, German, Hungarian, Italian, Japanese, Korean, Norwegian, Polish, Portuguese (Brazil and Portugal), Slovak, Spanish, Swedish and Turkish, for the format pane and every text inside the visual, also in Power BI Desktop.

    Post it on the public board at smartvisuals.io/feedback, where other users can vote and comment, or use the Report a bug block on the support page (smartvisuals.io/support) or email hello@smartvisuals.io. A screenshot and the fields you mapped help most; sample data is welcome but never required.

    Troubleshooting

    When it does not look right

    Found a bug or missing something? Post it on the requests board; the developer answers within two business days.

    The visual shows a setup guide that says "Missing: Impact".
    Risk (or Risk ID) and both measures are needed: Likelihood and Impact must each be a measure in its own well. The setup guide names what is still missing. In edit mode, See an example draws a built-in Helios register so you can see what the visual does first; Close example returns to the guide.
    A note says "N risks without a likelihood or an impact are not drawn".
    Those risks have a blank Likelihood or Impact in the current filter context, often because the measure returns blank for the latest review. Check the measure for that review; the risks are counted in the note rather than silently dropped.
    A note says values outside the scale were placed on the nearest level.
    A value such as 6 arrived on a 5-level axis. Set Matrix > Likelihood Levels (0 = auto) or Impact Levels (0 = auto) to the size of your scale, from 3 to 10, or fix the data. Out-of-range values are clamped to the nearest level and counted.
    Probabilities land in the wrong level.
    Set Matrix > Likelihood Values Are to Probability (0 – 1) or Percent (0 – 100) if auto-detect guessed wrong, and type your own Likelihood Cut Points: one fewer than the levels, in the unit of the data. A value exactly on a cut point belongs to the upper level.
    My per-cell band table is ignored.
    Scoring and Bands > Per-Cell Table needs exactly one line per likelihood level (highest first) and one value per impact level (low to high). Values can be band names, their unique first letters or B1 to Bn. Separate the cells with commas when band names contain spaces. A data note says what did not match, and the visual falls back to the automatic bands until it does.
    A risk shows in an old position.
    With Review period bound, the latest review in the data is drawn. If a risk sits where it was last quarter, it has no row in the latest review, or a filter removed that review. Check that the risk has a row for the current period.
    The cells show numbers instead of markers.
    Markers > Show Risks As is on Auto (markers, counts when crowded), which switches to counts when the busiest cell would hide most of its risks. Choose Markers or Names in the cells, make the visual larger, or lower Markers > Marker Size. A full cell shows a +n badge whose tooltip and click cover the hidden risks.
    Some arrows or appetite lines are missing.
    Residual and Target > Arrows on Auto draws arrows for every risk up to 15 drawn risks; with more, select a risk or choose Every risk. Risk Appetite > Appetite Lines on Auto draws every line when there are up to two category appetites, otherwise only the selected risks' categories; choose Every category to draw them all. The rings and the summary line always count every risk. Both cards are Premium.
    A cell note does not appear.
    Matrix > Cell Notes takes one line per cell written as likelihood,impact: text, for example 5,5: Escalate to the board. A note is drawn when the cell is at least 60 x 40 px and is always in the cell's tooltip and screen reader label.
    My readers do not see the residual positions, the appetite line or the register.
    Those layers are Premium and need a licence per reader, assigned in the Microsoft 365 admin center. Readers without one see the free matrix of the same data and a short Power BI licence note; the report is never blocked and nothing is watermarked. In edit mode every Premium layer previews in full.

    Accessibility

    Keyboard, screen readers and high contrast
    Tab
    Moves into the visual, which is one tab stop. The focus ring appears only for keyboard users.
    Arrow keys
    Move between the cells of the matrix, row by row, across both grids when opportunities are shown.
    Home / End
    Jump to the first or the last cell.

    . and , (or Page Down / Page Up)

    Walk the risks inside the focused cell, one by one.
    Enter or Space
    Selects the focused cell or risk and cross-filters the page. Hold Ctrl to add it to the selection.
    Esc
    Leaves the cell; pressed again, clears the selection.
    T
    Switches between the matrix and the data table.
    Shift+F10 or the Menu key
    Opens the Power BI context menu for the focused cell or risk, including drill-through.
    • Screen readers

      The visual's label is a one-sentence summary of the matrix and its highest risk. Every cell and every risk has a label, such as "Likely likelihood, Major impact, Critical, score 16: 3 risks", cell notes included, and a live region announces each cell or risk as the focus moves.

    • Data table

      Data Table > Matrix / Table Button lets readers switch to a real HTML table of every risk, sortable by clicking a column header. The T key does the same.

    • Not colour alone

      Accessibility > Band Patterns gives each band its own hatching, readable without colour and in print. Shapes by Category in the Markers card gives each category its own marker shape, and the review badges and rings are shapes, not tints.

    • High contrast

      In Windows high contrast mode the visual uses the system colours, always draws the band patterns and outlines the band chips in the register and table.

    • Focus outline and text size

      Accessibility > Focus Outline Colour and Focus Outline Width set the focus ring (high contrast always uses the system colour), and Minimum Text Size keeps every text at or above that size.

    • No animation

      Nothing in the visual moves on its own: markers, arrows and trails are drawn in place.

    • Context menu

      Right-clicking a marker, a cell, the legend, empty space or the setup guide opens the Power BI context menu; Shift+F10 does the same for the focused element.

    • Languages

      The format pane and every text inside the visual (setup guide, summary line, notes, tooltips, register and screen reader labels) are available in 20 languages, also in Power BI Desktop: Chinese (simplified and traditional), Czech, Danish, Dutch, English, French, German, Hungarian, Italian, Japanese, Korean, Norwegian, Polish, Portuguese (Brazil and Portugal), Slovak, Spanish, Swedish and Turkish.

    Missing something?

    Tell us what is missing.

    A feature you need, a bug you hit, a visual that does not exist yet. Every message reaches the person who builds these visuals, and feature requests shape what ships next. We also build visuals to order.

    Also in the family