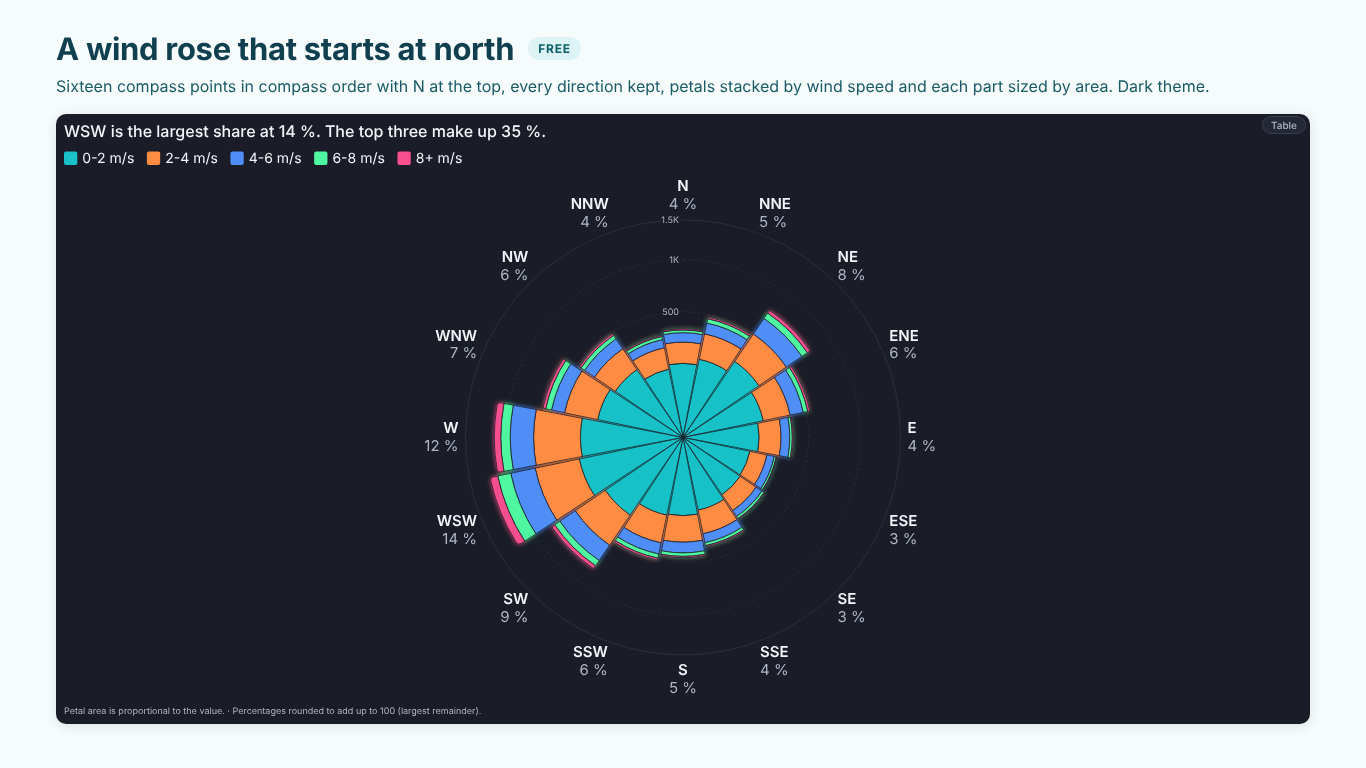
Rose chart and wind rose in Power BI: area not radius, months and compass points in order
A rose chart gives every category an equal slice of a circle and lets the value decide how far the petal reaches. Florence Nightingale used it in 1858 to show deaths by month and cause, which is why it is also called a Nightingale rose or coxcomb; today it is mostly called a polar area chart. Its natural home is anything that runs in a cycle: orders by month, alarms by hour of the day, wind by direction.
Power BI has no rose chart, and the workarounds tend to get the one thing wrong that makes the chart honest. This article covers that first, then the data shape for the most common rose of all, the wind rose, and the order problems every rose has.
Area, not radius
Most rose charts draw each petal with a length proportional to the value. It looks natural and it is wrong. A petal is a wedge of a circle, and the area of a wedge grows with the square of its radius. A month with twice the orders, drawn twice as long, covers four times the area, and area is what the eye reads.
The fix is to make the radius proportional to the square root of the value:
radius = maxRadius × √( value ÷ maxValue )
Now a petal with twice the value has twice the area and reaches about 1.41 times as far. Large months no longer dwarf small ones, and the chart says what the numbers say. If a petal looks "too small" next to the biggest one, that is usually the honest reading.
There are cases for radius encoding (an aster chart, where a second measure also sets the angle, reads lengths rather than areas), but then the chart should say so. A footnote such as "Petal radius is proportional to the value (areas exaggerate large values)" is enough.
The wind rose: from readings to petals
A weather station logs a direction in degrees and a speed for every interval. A wind rose shows how often the wind blew from each direction, with each petal split into speed bands. The Helios Chicago plant uses one to see where dust and cooling-tower drift go.
Bin the direction into 16 compass points with a calculated column. Each point covers 22.5°, centred on its heading, so north runs from 348.75° to 11.25°:
Compass Index =
MOD ( ROUND ( Wind[Direction] / 22.5, 0 ), 16 )

Compass =
SWITCH (
    Wind[Compass Index],
    0, "N",   1, "NNE", 2, "NE",  3, "ENE",
    4, "E",   5, "ESE", 6, "SE",  7, "SSE",
    8, "S",   9, "SSW", 10, "SW", 11, "WSW",
    12, "W",  13, "WNW", 14, "NW", 15, "NNW"
)
The MOD folds 360° (and anything rounding to 16) back to north. Set Sort by column on Compass to Compass Index, so N, NNE, NE and the rest stay in compass order instead of the alphabet (E, ENE, ESE, N...).
Speed bands work the same way:
Speed Band =
SWITCH (
    TRUE (),
    Wind[Speed] < 2, "0-2 m/s",
    Wind[Speed] < 4, "2-4 m/s",
    Wind[Speed] < 6, "4-6 m/s",
    Wind[Speed] < 8, "6-8 m/s",
    "8+ m/s"
)
with a Speed Band Order column from 1 to 5 for sorting. The value is a count of intervals, or hours, per direction and band: Hours = COUNTROWS ( Wind ) if each row is one hour.
Two details matter for the reading. Calms (speed near zero) have no meaningful direction; leave them out of the petals and state their share in a note rather than piling them onto north. And empty directions must keep their place: if the wind never blew from ESE, the ESE slot stays empty. A chart that closes the gap shifts every following petal and turns south-east into east.
When the petals are stacked by speed band, the area rule applies to every band, not only to the outer edge. Each band is a ring segment whose area should match its count, which means its inner and outer radius both come from cumulative square roots. Done with a simple stacked layout on radius, the outer bands of a long petal look far larger than they are.
Months, weekdays and hours in their cycle
A rose of orders by month has the same order problem as the compass. Month names sort alphabetically unless you sort them by a month number, and in a rose that is visible at a glance: April next to August, December at the top.
The usual fix is a date table with Month Name sorted by Month Number. For hours, a text column such as "06:00" sorts correctly by itself, but "6 AM" does not; keep an hour number next to it. Weekdays need a weekday number that starts on the day your organisation starts its week.
Two more rules for cycles:
- Do not fold periods into Other. A Top N + Other rule that is sensible for products would turn the three quietest months into "Other", which breaks the cycle. A rose of months always has twelve petals.
- Put the start of the cycle at the top. January (or the first month of the fiscal year), midnight, and north at 12 o'clock. A half circle works for a shift: twelve hours from 06:00 to 17:00 on a semicircle, with the shift's total in the hole in the middle.
Comparing seasons
A single rose shows the shape of one year. The question in a review is whether this year's shape is normal. Two roses side by side make the reader compare petals across charts, which is hard.
Draw past seasons as outlines on the same rose instead: this year as filled petals, last year as a dark outline, the years before as fainter outlines. A petal that sticks out past all its outlines is a real departure. For the numbers behind it, compute a seasonal index per month (the month's value divided by the average month of the same year, so 100 % is an average month) and compare the peak with its average in the past seasons:
Seasonal Index =
DIVIDE (
    [Orders],
    AVERAGEX ( ALLSELECTED ( 'Date'[Month Name] ), [Orders] )
)
In the Helios order data, August 2025 is the peak at 144 % of an average month, and 43 % above its average of the three seasons before.
When a rose is the wrong chart
A rose is a poor choice when the categories are not a cycle (plants, products), when the values need to be compared precisely (lengths on a common baseline beat areas around a centre), and when there are more than about 24 petals. For a ranking of plants, use a bar chart; for a share of a whole, a donut. The rose earns its place when the circle itself means something.
Doing it in one visual
The DAX above prepares the data; drawing petals by area, stacking bands by cumulative area and keeping empty slots open is the visual's job.
SmartVisuals Rose sizes petals by area by default and says so in the footnote. It recognises months, weekdays, hours and 4, 8 or 16 compass points and keeps them in their cycle, puts north or midnight at the top with gaps kept, stacks petals by a Segment field with every band sized by area, and offers by radius and aster on request. Half and three-quarter arcs, a radial axis, a centre total, Top N + Other for categories that are not a cycle, and icons in petals are free and never watermarked.
Premium adds last period's outline on every petal, up to six past seasons as fading outlines with how far the peak sits above its seasons' average, targets per petal, seasonality findings and small multiples, for $1.99 per user per month or $19 per user per year. The same rose is part of SmartVisuals Part-to-Whole with pie and donut, radial bar, waffle, pictogram, funnel and Marimekko. Both have been submitted to Microsoft Marketplace and are not published yet; the product pages will link to the listings once they are live.
Try AI Chatbot for Free
Experience the power of conversational analytics in your Power BI reports. Get your free license in seconds - no credit card required.
Get Free License