What is a rose chart, and why should petals be sized by area?
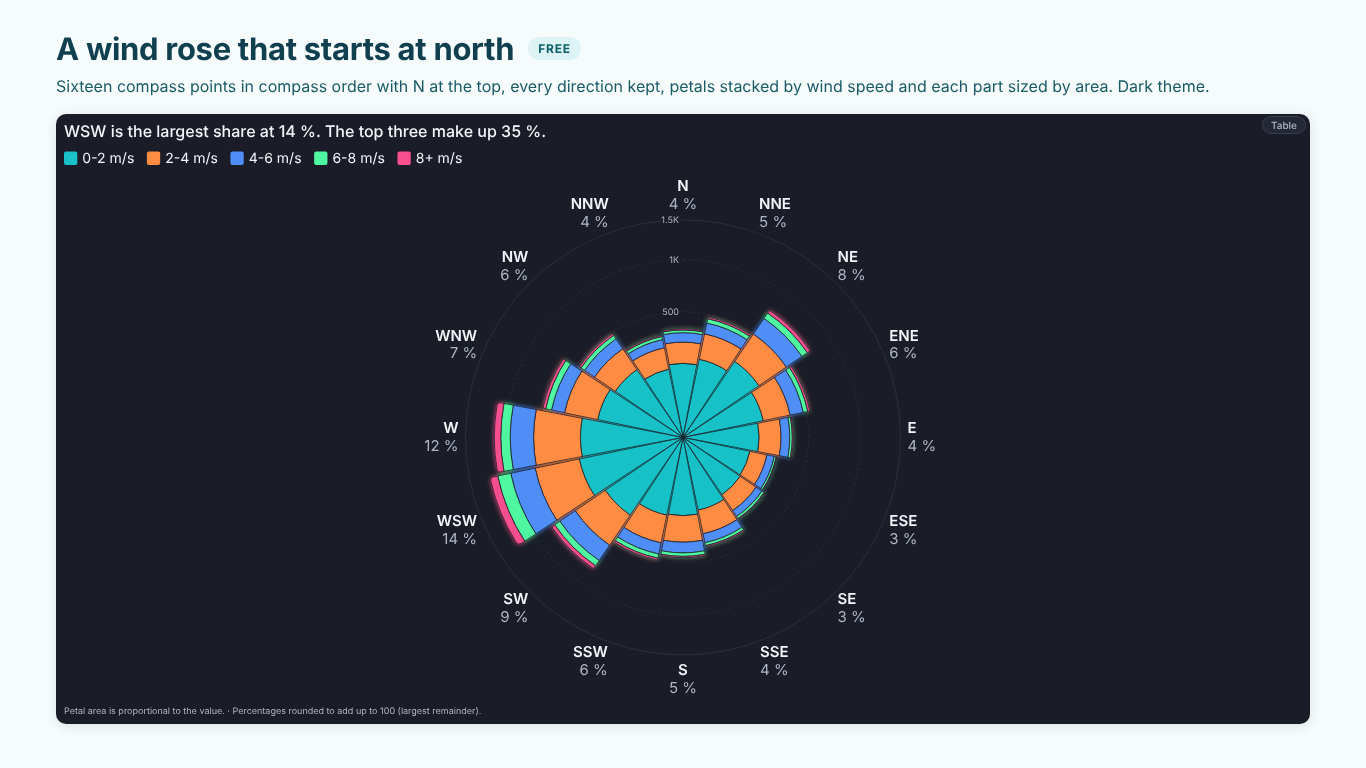
A rose chart (polar area chart, Nightingale rose, coxcomb) gives every category an equal slice of the circle and lets the value decide how far the petal reaches. It suits cycles: months of the year, hours of a shift, days of the week, compass directions. The trap is the radius. If a petal's length is proportional to its value, its area grows with the square of the value, and a month with twice the orders looks four times as big.
SmartVisuals Rose sizes petals by area by default (Rose > Petal Size > By area (honest)): a petal twice the value has twice the area, and the footnote says "Petal area is proportional to the value." By radius is available on request, with a footnote that the areas exaggerate large values, and Aster takes the petal angle from a second measure in Angle (aster), so two measures read in one rose.