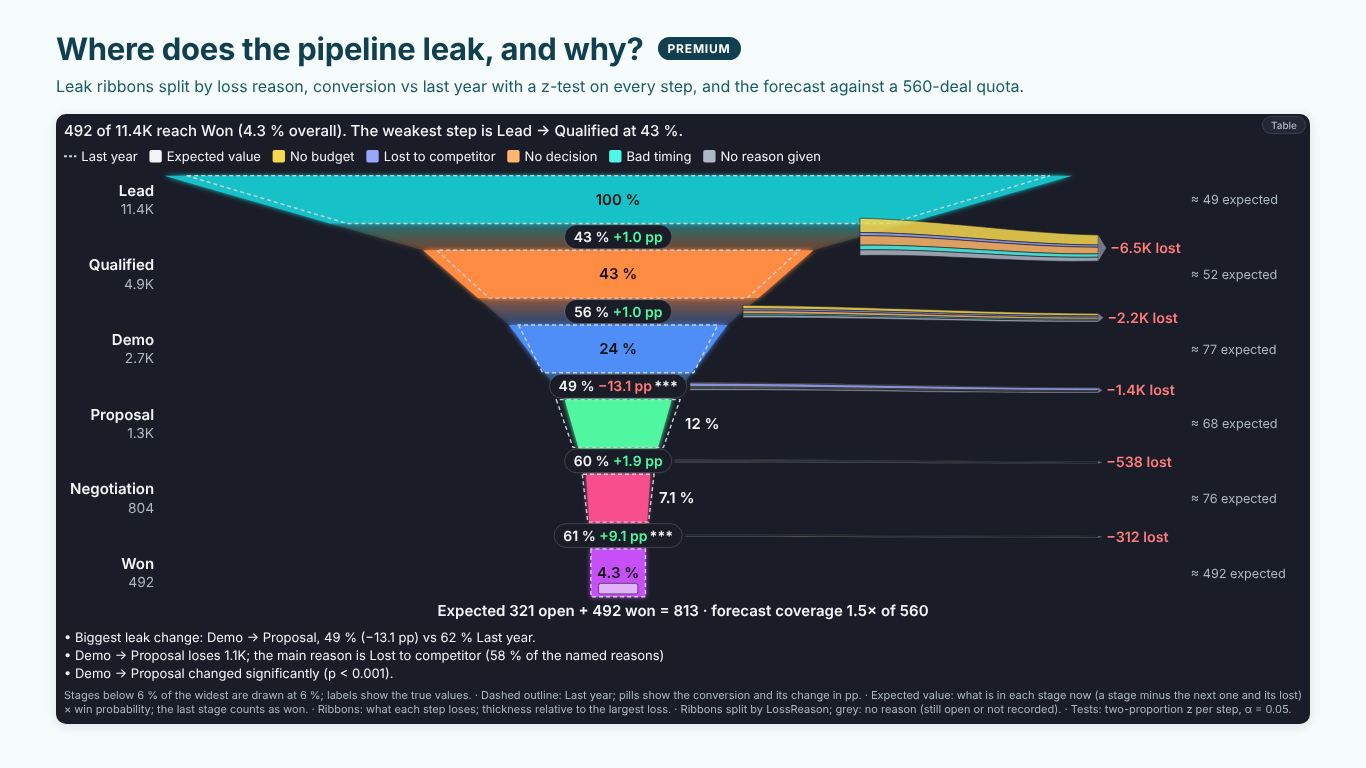
Sales pipeline funnel in Power BI: stage order, conversion in points and whether the drop is real
The pipeline slide in a monthly sales review asks three questions. How many opportunities made it through each stage? Where do we lose the most? And did that get better or worse since last year? A funnel chart answers the first one well. The second and third are where most pipeline pages go wrong: the stages come out in the wrong order, the conversion changes are shown as percentages of percentages, and nobody can say whether a drop from 62 % to 49 % is a trend or a bad month.
This article walks through the data shape, the measures and one statistical test, with an example from the fictional Helios Manufacturing sales team: Lead, Qualified, Demo, Proposal, Negotiation and Won.
Keep the stage order as a number
The first thing that goes wrong is order. Power BI sorts a text axis alphabetically or by value, and neither is the order of a sales process: alphabetically, Demo comes before Lead and Won ends up after Qualified. Sorted by value, the funnel looks right until a later stage happens to be larger than an earlier one, and then two stages swap places.
Keep a small stage table with a number:
| Stage | Stage Order | Win Probability |
|---|---|---|
| Lead | 1 | 5 % |
| Qualified | 2 | 10 % |
| Demo | 3 | 20 % |
| Proposal | 4 | 40 % |
| Negotiation | 5 | 65 % |
| Won | 6 | 100 % |
In the built-in funnel you set Sort by column on Stage to Stage Order. In a custom visual that takes the order as a field, a measure is enough:
Stage Order = MIN ( Stages[Stage Order] )
Win Probability is not needed for the funnel itself; it comes back at the end for the expected value.
Cumulative or in stage: decide what a stage counts
There are two honest ways to count a stage, and they give different funnels.
Cumulative: each stage counts every opportunity that ever reached it. An opportunity now in Proposal counts in Lead, Qualified, Demo and Proposal. This is the classic funnel, and the only one where "conversion from Demo to Proposal" means what it says. If your opportunity table stores the furthest stage each opportunity reached as a number, the measure is a comparison against the stage on the axis:
Opportunities Reached =
VAR ThisStage = SELECTEDVALUE ( Stages[Stage Order] )
RETURN
    CALCULATE (
        COUNTROWS ( Opportunities ),
        Opportunities[Furthest Stage Order] >= ThisStage
    )
The Stages table is not related to Opportunities for this to work; it only provides the axis. A lost opportunity keeps the furthest stage it reached, so it counts up to the stage where it was lost and no further.
In stage: each stage counts only the opportunities that are in it now. This is what a CRM snapshot usually gives you, and it is the right base for a forecast, because every open deal is counted exactly once. It is not a funnel of conversions: a stage can be larger than the stage before it simply because many deals arrived there this month.
Pick one and say which in the title or the footnote. Mixing them, for example a CRM export of open deals per stage drawn as a conversion funnel, produces conversion rates above 100 % and drop-offs that are not drop-offs.
Two percentages per stage
With cumulative counts, every stage carries two percentages:
% of First =
VAR FirstStage =
    CALCULATE (
        [Opportunities Reached],
        REMOVEFILTERS ( Stages ),
        Stages[Stage Order] = 1
    )
RETURN
    DIVIDE ( [Opportunities Reached], FirstStage )

% of Previous =
VAR ThisStage = SELECTEDVALUE ( Stages[Stage Order] )
VAR Previous =
    CALCULATE (
        [Opportunities Reached],
        REMOVEFILTERS ( Stages ),
        Stages[Stage Order] = ThisStage - 1
    )
RETURN
    IF ( ThisStage > 1, DIVIDE ( [Opportunities Reached], Previous ) )
REMOVEFILTERS ( Stages ) matters: the axis filters the stage name, and without it the filter on the order would meet the name of the current stage and return nothing.
% of First says how much of the original volume is left: 492 won of 11,400 leads is 4.3 %. % of Previous is the step conversion, and it is the one that tells you where to act. In the Helios pipeline the weakest step is Lead to Qualified at 43 %, but the step that changed most is Demo to Proposal, and that is where the review should spend its time.
The lost volume per step is the difference between the previous stage and this one. Showing it next to the funnel, as a number or as a ribbon peeling off the side, keeps the reader from reading a narrow stage as a small problem: at the top of a funnel a small percentage is a lot of deals.
Compare conversion in points, not in percent
"Demo to Proposal conversion fell 21 %" and "Demo to Proposal conversion fell 13 points" can describe the same change, from 62 % to 49 %. The first is the percentage change of a percentage, and it confuses everybody. Compare conversion rates in percentage points:
% of Previous LY =
CALCULATE ( [% of Previous], SAMEPERIODLASTYEAR ( 'Date'[Date] ) )

Conversion Change (pp) =
( [% of Previous] - [% of Previous LY] ) * 100
For this to filter correctly, the date table must be related to the date the opportunity entered the pipeline, not to the date of its last update. Otherwise opportunities created last year and won this year move between periods, and last year's funnel changes every time someone updates a deal.
Is the drop real? A two-proportion z-test in DAX
A 13-point drop sounds alarming. Whether it is depends on how many opportunities stand behind it. Suppose 2,700 opportunities reached Demo this year and 1,323 of them went on to Proposal (49 %), against 1,612 of 2,600 last year (62 %). The question is whether two conversion rates differ by more than chance would explain, and the standard answer is a two-proportion z-test:
Step z =
VAR ThisStage = SELECTEDVALUE ( Stages[Stage Order] )
VAR x1 = [Opportunities Reached]
VAR n1 =
    CALCULATE (
        [Opportunities Reached],
        REMOVEFILTERS ( Stages ),
        Stages[Stage Order] = ThisStage - 1
    )
VAR x2 =
    CALCULATE ( [Opportunities Reached], SAMEPERIODLASTYEAR ( 'Date'[Date] ) )
VAR n2 =
    CALCULATE (
        [Opportunities Reached],
        REMOVEFILTERS ( Stages ),
        Stages[Stage Order] = ThisStage - 1,
        SAMEPERIODLASTYEAR ( 'Date'[Date] )
    )
VAR p1 = DIVIDE ( x1, n1 )
VAR p2 = DIVIDE ( x2, n2 )
VAR pooled = DIVIDE ( x1 + x2, n1 + n2 )
VAR se = SQRT ( pooled * ( 1 - pooled ) * ( 1 / n1 + 1 / n2 ) )
RETURN
    IF ( ThisStage > 1 && n1 > 0 && n2 > 0, DIVIDE ( p1 - p2, se ) )
Last year's values are written out in full on purpose: a variable is evaluated once, so CALCULATE ( x1, SAMEPERIODLASTYEAR ( ... ) ) would quietly return this year's number again.
The p-value is the two-sided tail of the normal distribution:
Step p = 2 * ( 1 - NORM.S.DIST ( ABS ( [Step z] ), TRUE ) )
For the Helios numbers z is about −9.5 and p is far below 0.001: the drop is real. The same 13 points on 100 opportunities a year would give z = −1.85 and p = 0.064, which is not significant at the usual 5 % level. Same chart, opposite conclusion; that is why the test belongs next to the pill.
Three conditions keep the test honest:
- Counts, not amounts. The test is about how many opportunities converted. Pipeline value in dollars is not a count of independent trials, and a z-test on revenue gives confident nonsense. Test the opportunity count even when the funnel shows value.
- Nested stages. Every opportunity in Proposal must also be in Demo. If a later stage is larger than the one before it (cumulative counts make that impossible; in-stage counts make it common), the step is not a proportion and should not be tested.
- Enough volume. With a handful of opportunities in a step the normal approximation breaks down. Leave those steps untested and say so, rather than starring a coin flip.
An expected value you can defend
The last number on the slide is usually the forecast: pipeline times win probability. The classic mistake is to multiply the cumulative funnel by the probabilities, which counts a deal in Negotiation five times, once in every stage it passed. Weight only what is in each stage now. With cumulative counts that is the stage minus the next one; with an in-stage snapshot it is the stage itself:
Here Pipeline Value is the same measure as Opportunities Reached with SUM ( Opportunities[Amount] ) in place of COUNTROWS, and Win Probability is MIN ( Stages[Win Probability] ):
In Stage Now =
VAR ThisStage = SELECTEDVALUE ( Stages[Stage Order] )
VAR NextStage =
    CALCULATE (
        [Pipeline Value],
        REMOVEFILTERS ( Stages ),
        Stages[Stage Order] = ThisStage + 1
    )
RETURN
    [Pipeline Value] - NextStage

Expected Value =
SUMX ( VALUES ( Stages[Stage] ), [In Stage Now] * [Win Probability] )
Won counts at 100 %, and lost deals must not sit in the "in stage now" volume of the stage where they died: if your data records a loss reason, subtract the lost deals first. Expected open plus won, divided by the quota, is the forecast coverage the director will ask about.
Putting it on one chart
With those measures, the usual page is a funnel, a table of conversions, a card with the forecast and a separate visual for last year. We built SmartVisuals Funnel & Pyramid to put the review on one chart. Stage goes to Category, the count or value to Values and Stage Order to Stage order, and the funnel keeps the process order whatever the numbers do. % of first, % of previous, drop and lost, conversion pills between the stages, leak ribbons that peel each step's loss off to the side, stacked segments, pyramids and data checks for duplicated stages or a later stage that is larger are free, with no watermark and no row cap.
The pipeline review is premium: bind last year to Compare and every pill shows the change in points, with stars from the two-proportion z-test above (it tests counts only and says why a step was not tested); Win probability gives the expected value on what is in each stage now, with coverage against a quota; a Loss reason field splits the leak ribbons by reason; and What If lifts one step by a few points and draws the extra wins as a ghost of the lifted funnel. Premium is $1.99 per user per month or $19 per user per year; readers without a licence see the free funnel, never a blank one. The visual has been prepared for Microsoft Marketplace and is not published there yet. It is also one of the views of SmartVisuals Part-to-Whole, next to pie and donut, waffle, Marimekko and more.
The checklist
Whatever you draw the pipeline with, it holds up when:
- stages are ordered by a number, not by name or by size;
- the funnel says whether it counts cumulative or in-stage volumes;
- conversion changes are in percentage points, on the date the opportunity entered the pipeline;
- a drop is called real only after a test on counts, with enough volume behind it;
- the forecast weights what is in each stage now, each deal once, and Won at 100 %.
Try AI Chatbot for Free
Experience the power of conversational analytics in your Power BI reports. Get your free license in seconds - no credit card required.
Get Free License