A funnel that keeps its stages in order, and says whether the drop is real
Stage order from a field, % of first and previous, drop and lost, leak ribbons and pyramids, free and never watermarked. Premium is the pipeline review: conversion against last year in points, a z-test per step, targets, expected value and coverage, what-if and loss reasons.
Per user, assigned in the Microsoft 365 admin center, with a 30-day free trial. Unlicensed viewers see the free tier, never a blocked visual.
Data
Computed inside Power BI. No external calls, no API keys, no telemetry.
Visuals API
5.11.0
Accessibility
One tab stop with arrow-key navigation, screen-reader live region and chart label, accessible data table, fill patterns, high contrast, reduce motion, focus outline and minimum text size
Funnel (vertical or horizontal; tapered, straight bars or curved), pyramid, inverted pyramid
Data volume
30,000 rows per window, up to 150,000; no row cap on the free tier
Statistics
Two-proportion z-test per step and expected value, computed inside the visual and golden-tested against scipy
Network
No external calls, no telemetry
Works in
Power BI Desktop, Service, Embedded
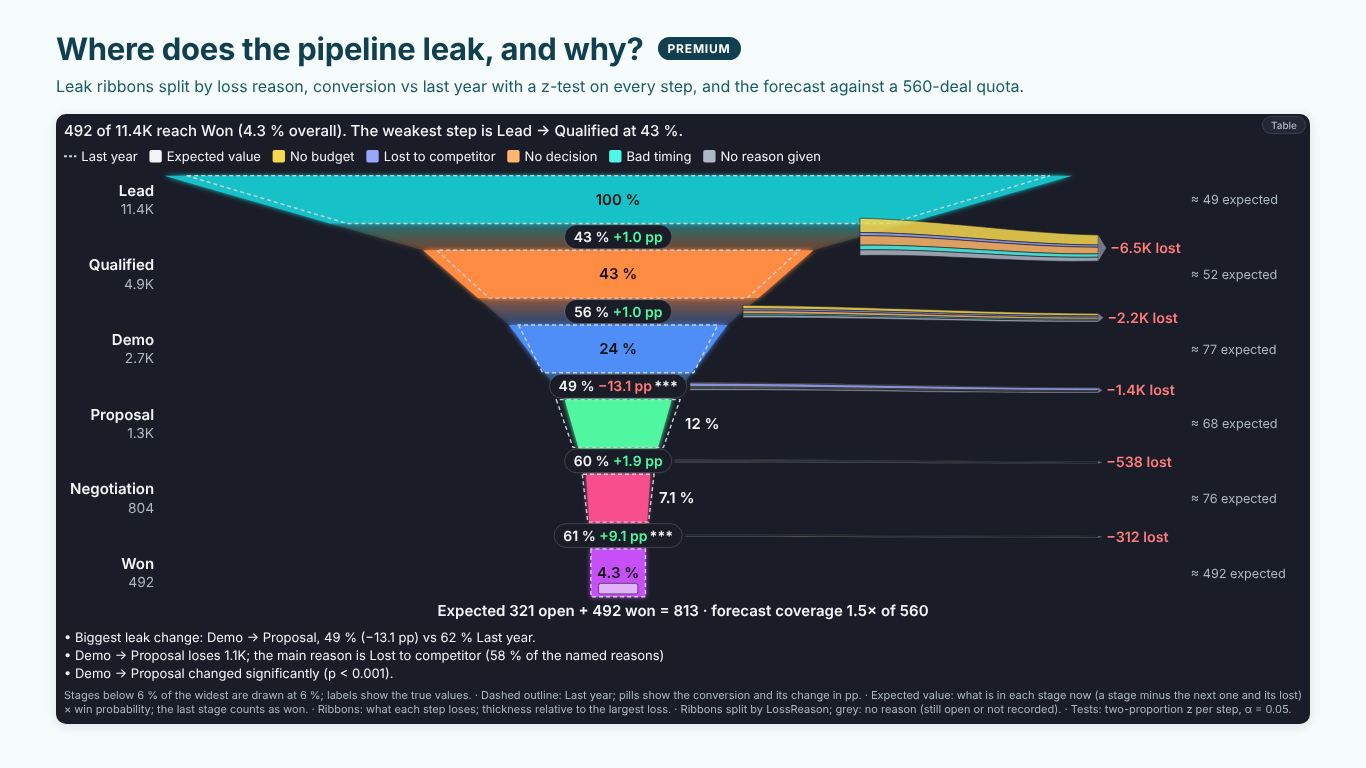
Pl. LII · Funnel & Pyramid · Premium: where the pipeline leaks and why, against last year, with a z-test on every step and the forecast against a 560-deal quota.rendered from the shipped visual
What it does
SmartVisuals Funnel & Pyramid draws a funnel, a pyramid or an inverted pyramid from a Category and a measure, in the order of your stages rather than their size. Every stage carries % of first stage, % of previous stage, drop and lost; conversion pills sit between the stages, leak ribbons show what each step loses, and a smart caption names the weakest step. Segments stack inside each stage, and data checks in edit mode catch duplicated stages and a later stage larger than the one before.
Premium answers the monthly pipeline question: how did conversion move against last year or plan, and is the move real? A dashed outline and the change in points on every pill, a golden-tested z-test per step, targets per stage, segments side by side, the expected value on what is in each stage now with coverage against a quota, what-if uplift at one step, loss reasons on the leak ribbons and findings. Every premium feature previews free while you edit, readers without a licence always see the free funnel, and the visual makes no external calls. The same funnel is one of the views of SmartVisuals Part-to-Whole (smartvisuals.io/visuals/part-to-whole).
Free and premium
Where the line is, exactly.
Report authors see the full premium set in edit mode, so you can evaluate every feature on your own data before assigning a single licence. Unlicensed viewers always get a working chart.
Free tierevery viewer
Stage order fieldStages follow your sort column (1, 2, 3...), not the data order or the size. Without it the funnel keeps the data order.
The numbers a pipeline review needs% of first, % of previous, drop % and lost per stage, and a conversion pill between stages.
Leak ribbonsWhat each step loses peels off the funnel, labelled, with its thickness relative to the largest loss.
ShapesVertical or horizontal; tapered, straight bars or curved; connector areas; a minimum stage width with the true value labelled and footnoted.
Pyramid and inverted pyramidEqual or proportional level heights, for safety pyramids and headcount pyramids.
Stacked stagesA Segment field stacks every stage by region, channel or product, with a segment legend.
Data checks and no row capEdit mode names duplicate stages, a later stage larger than the one before and negative stages. The free tier has no row cap.
Smart caption and footnote"492 of 11.4K reach Won (4.3 % overall). The weakest step is Lead → Qualified at 43 %." The footnote states the methods.
Power BI featuresTooltips and report page tooltips, highlight and cross-filter, Ctrl to add, bookmarks, context menu, drilldown and a show condition.
Templates, themes and on-object formattingSix templates (Executive, IBCS (Finance), Minimal, Presentation, Print, Infographic), four themes, four fonts, conditional formatting (fx), colour rules, patterns, transparent background and formatting on the canvas.
Accessibility and 20 languagesOne tab stop with arrow keys, a screen-reader live region, an accessible data table, high contrast with fill patterns and a responsive layout for small tiles.
Premium$1.99 /user/mo · first month free
Compare with last period or planA dashed outline per stage and the conversion change in points on every pill.
Two-proportion z-test per stepStars on the steps that changed significantly, when the measure is a count; the footnote says why a step was not tested. Golden-tested against scipy.
Targets per stageA Target field per stage, met, close or missed in the status colours.
Segments side by side and small multiplesOne funnel per region on a shared scale, or one panel per value of a Small multiples field.
Expected value and pipeline coverageWin probability on what is in each stage now, each deal once and Won at 100 %, for cumulative or in-stage data; coverage of the forecast or the open pipeline against a quota.
What ifLift one step by N points and see the extra won, drawn as a ghost of the lifted funnel.
Loss reasonsA Loss reason field splits every leak ribbon by reason, and the findings name the main one.
FindingsUp to five sentences with "how calculated": the biggest leak change, the significant steps, missed targets, the forecast.
Getting started
From empty canvas to first chart.
01
Add SmartVisuals Funnel & Pyramid to the page. With no fields bound it opens on its setup guide, which names the wells that are still empty.
02
Drop the stages into Category and a measure, such as Opportunities, into Values.
03
Bind a measure that returns the stage number, such as MIN ( Stages[Stage Order] ), to Stage order so the stages keep the process order.
04
Under Funnel & Pyramid, pick the chart (Funnel, Pyramid or Inverted pyramid), the shape and the numbers per stage, and turn on Leak Ribbons; Format pane > Templates sets a whole style at once.
05
Optional, premium: bind last year to Compare, a Win probability, a Target or a Loss reason, or turn on Significance, What If or Findings. Everything previews in full while you edit.
Get Funnel & Pyramid
On its way.
Installation instructions for both paths are on the download page.
Microsoft Marketplace (recommended)
The offer is prepared for Microsoft Marketplace and not published yet. This page will link to the listing the moment it is live.
Coming soon
Documentation
Everything else about Funnel & Pyramid.
The guide, use cases, questions and the full settings reference. Open what you need, or search.
Funnel & Pyramid in Power BI, explained
6 short chapters: what the visual does and why
How do I keep funnel stages in the right order in Power BI?
A funnel that sorts by name puts Demo before Lead, and one that sorts by value swaps two stages the month a later stage is larger. SmartVisuals Funnel & Pyramid has a Stage order field: bind a measure that returns the stage number (1, 2, 3...) and the stages follow it whatever the counts do. Without it the funnel keeps the data order, never the size; Sorting and Other > Sort can also be set to Stage order field, Largest first or Name.
Data Checks in edit mode name what usually goes wrong with pipeline data: a stage name that appears twice, a later stage that is larger than the one before it (allowed, but the stages are then not subsets) and negative stages. There is no row cap.
Which numbers does it show per stage, and what are leak ribbons?
Every stage can carry % of first stage, % of previous stage, drop % and the lost volume (Funnel & Pyramid > % of First Stage, % of Previous Stage, Drop % and Lost (Absolute)), and Conversion Pills put the step conversion between the stages. The smart caption names the result and the weakest step, such as "492 of 11.4K reach Won (4.3 % overall). The weakest step is Lead → Qualified at 43 %."
Leak Ribbons (What Each Step Loses) peels the volume each step loses off to the side of the funnel, labelled, with its thickness relative to the largest loss. A narrow stage at the bottom then no longer hides that the top of the funnel loses thousands of leads. Leak ribbons are free; splitting them by a Loss reason field is premium.
Can it draw a pyramid or an inverted pyramid?
Yes, free. Funnel & Pyramid > Chart switches between Funnel, Pyramid and Inverted pyramid, and Level Heights between Equal and Proportional to value. A safety pyramid puts lost-time injuries at the apex and unsafe acts observed at the base; a headcount pyramid does the same by grade. The funnel itself can be vertical or horizontal, tapered, straight bars or curved, with or without connector areas.
Stages below Minimum Stage Width (%) (6 % of the widest by default) are drawn at that width so they stay visible and clickable; the label always shows the true value and the footnote says so. A Segment field stacks each stage by region or channel, with a segment legend.
How do I see whether a drop in conversion is real?
This is the pipeline review, and it is premium. Bind last year or the plan to Compare and every stage gets a dashed outline of the comparison, while every conversion pill shows the change in points, such as "49 % −13.1 pp". Significance > Test the Change runs a two-proportion z-test per step and stars the steps that changed significantly; with a Segment and no Compare it can test the segments against the first one.
The test needs counts of opportunities, candidates or sessions. Amounts are never tested as counts, and the footnote says why a step was not tested: values are not counts, a later stage is larger, or too few counts. Values Are sets it explicitly when Automatic (whole numbers, not currency or percentages) guesses wrong. The z-test is golden-tested against scipy.
How does the expected value and pipeline coverage work?
Bind Win probability per stage (premium, as a fraction or a percentage) and Pipeline & Forecast > Show Expected Value weights what is in each stage now, each deal counted once, with the last stage counted as won (Last Stage Is Won). With cumulative stages, what is in a stage now is the stage minus the next one (and its lost, with a Loss reason field); Stages Are set to In stage takes each stage as it is, for CRM snapshots of open deals.
Pipeline Coverage compares the forecast (expected plus won) or the open pipeline with a quota, typed or taken from the last stage's Target: "Expected $66.2M open + $23.8M won = $89.9M · forecast coverage 0.95× of $95.0M". What If > Lift One Step raises one step's conversion by a number of points, the weakest step unless you name one, carries it through the later steps at their own rates and draws the result as a ghost of the lifted funnel.
What do report readers without a licence see?
Always a working funnel. A reader without a licence sees the free chart of the same data, with stage order, conversions, leak ribbons and pyramids, and Power BI shows its own short licence note; the visual is never blocked and never watermarked. Comparisons, targets, tests, the expected value, what-if and loss reasons are left out, and side-by-side segments and small multiples show the first panel with its name. An unconfigured visual uses no premium feature, so it never raises that note.
In edit mode and in Power BI Desktop every premium feature previews in full on your own data. Premium is $1.99 per user per month or $19 per user per year through Microsoft Marketplace, assigned per user in the Microsoft 365 admin center. The funnel is also a view of SmartVisuals Part-to-Whole (smartvisuals.io/visuals/part-to-whole), with pie and donut, rose, radial bar, waffle, pictogram and Marimekko over the same fields.
Use cases
Where Funnel & Pyramid earns its place
The monthly pipeline review for Helios sales
Sales operations counts opportunities per stage: Lead, Qualified, Demo, Proposal, Negotiation and Won. Stage goes to Category, Opportunities to Values and a stage number to Stage order, so the funnel keeps its order whatever the counts. Leak Ribbons shows what each step loses, and the caption names the weakest step, such as "The weakest step is Lead → Qualified at 43 %". Last year's counts in Compare (premium) put the change in points on every conversion pill, with a star where Significance > Test the Change finds it real.
An expected value the sales director can defend
With pipeline value per stage in Values, Win probability per stage bound (premium) and Pipeline & Forecast > Show Expected Value on, every open deal is counted once, in the stage it is in now, and Won at 100 %. A Region field in Segment with Segment Field As set to Side by side (premium) draws one funnel per region on a shared scale, and Pipeline Coverage set to Forecast compares the forecast with the quota, such as "0.95× of $95.0M".
A recruitment funnel with the reasons candidates drop out
HR tracks candidates from Applied through Screened, Interviewed and Offer to Hired. With Leak Ribbons on, each drop peels off to the side with its count; binding a Loss reason column (premium), such as Withdrew, Rejected or Salary, splits every ribbon by reason, and the findings name the main reason at the biggest leak.
A safety pyramid for the Milwaukee plant
The EHS team keeps incident counts by severity: Lost-time injury, Recordable injury, First-aid case, Near miss reported and Unsafe act observed. Funnel & Pyramid > Chart set to Pyramid puts the most severe at the apex, Level Heights stays Equal or turns Proportional to value, and Inverted pyramid is one switch away. The same works for a headcount pyramid by grade.
The funnel, pyramid and inverted pyramid are free with stage order, % of first and previous, drop and lost, conversion pills, leak ribbons, stacked segments, data checks, templates, themes, accessibility and 20 languages, with no watermark and no row cap. Premium, the pipeline review, adds the comparison in points, the z-test per step, targets per stage, segments side by side, small multiples, expected value and coverage, what-if, loss reasons and findings, for $1.99 per user per month or $19 per user per year through Microsoft Marketplace.
The visual has been submitted to Microsoft Marketplace and is not published yet. This page will link to the listing once it is live.
The free funnel of the same data, never a blocked or watermarked visual. Comparisons, targets, tests, the expected value, what-if and loss reasons are left out, and side-by-side segments and small multiples show the first panel with its name. Power BI shows its own short licence note once. In edit mode every premium feature renders in full.
No. The visual declares no privileges, makes no external calls and sends no telemetry. Every number, the z-test and the expected value included, is computed inside the visual in your report. The licence is checked through Power BI's own licensing service.
Category (the stages) and a measure in Values. Optional: Stage order, Segment (stacked or side by side), Tooltips, Annotation (a text measure that pins a note on a stage) and Show condition, plus the premium wells Compare, Target, Win probability, Loss reason and Small multiples.
The funnel follows the data order by default, which is not always the process order. Bind a stage number to Stage order: with Sorting and Other > Sort on Data order the funnel then follows it. Sort can also be set to Stage order field, Largest first or Name.
The two-proportion z-test needs counts of opportunities, candidates or sessions. Amounts such as revenue are never tested as counts ("values are not counts"), a step where the later stage is larger is not a proportion ("a later stage is larger"), and very small steps are left out ("too few counts"). Significance > Values Are sets Counts explicitly when Automatic guesses wrong.
No. The expected value weights what is in each stage now: with cumulative stages, the stage minus the next one (and its lost, with a Loss reason field); with Stages Are set to In stage, each stage as it is. The last stage counts as won at 100 % unless you switch off Last Stage Is Won.
Funnel & Pyramid is the single-view edition. SmartVisuals Part-to-Whole (smartvisuals.io/visuals/part-to-whole) holds this funnel plus pie and donut, rose, radial bar, waffle, pictogram and Marimekko over the same fields, with the same free tier and premium layer, for $4.49 per user per month. Microsoft licenses every offer separately, so a licence for one never unlocks the other. For one or two chart types the single views ($1.99 each) cost less; for three or more, the multi-view does.
Yes. The chart is one tab stop: the arrow keys move between stages, Home and End jump to the first and last, Enter or Space selects (Ctrl adds) and Escape clears. A polite live region reads each stage with its value and share, the chart is labelled with its smart caption, and the Table button switches to an accessible data table. High contrast uses the system colours with fill patterns.
20: English, Czech, Danish, Dutch, French, German, Hungarian, Italian, Japanese, Korean, Norwegian, Polish, Portuguese (Brazil), Portuguese (Portugal), Slovak, Spanish, Swedish, Turkish and Chinese (Simplified and Traditional), for the format pane and every string the visual writes. Numbers follow the report's locale.
Post it on the public board at smartvisuals.io/feedback, where other users can vote and comment, or use the Report a bug block on the support page (smartvisuals.io/support) or email hello@smartvisuals.io. A screenshot and the fields you bound help most.
The visual shows a setup page instead of a funnel.
A field is still missing. Drop the stages into Category and a measure into Values; the setup page names the wells that are still empty. In edit mode, Format pane > Templates applies a style (Executive, IBCS (Finance), Minimal, Presentation, Print or Infographic) without touching fields or premium settings.
My stages are in the wrong order.
The funnel follows the data order by default, which is not always the process order. Bind a stage number (1, 2, 3...) to Stage order: with Sorting and Other > Sort left on Data order, the funnel then follows it. Sort can also be set to Stage order field, Largest first or Name.
Edit mode says "A stage is larger than the stage before it".
That is a data check, shown only in edit mode (Funnel & Pyramid > Data Checks). It is allowed, but it usually means the stages are not subsets of each other, for example an express path that skips a stage. The step's conversion is above 100 %, and Significance does not test it ("not tested: a later stage is larger"). The same check names duplicated stage names and negative stages.
Significance says "not tested: values are not counts".
The z-test per step needs counts of opportunities, candidates or sessions, and amounts are never tested as counts. With Values Are on Automatic, whole numbers that are not currency or percentages count as counts. Bind a count measure, or set Significance > Values Are to Counts when the values really are counts. "Too few counts" means a step is too small to test.
A small stage is drawn wider than its value.
Stages below Funnel & Pyramid > Minimum Stage Width (%) (6 % of the widest by default) are drawn at that width so they stay visible and clickable; the label always shows the true value and the footnote says so. Set the minimum to 0 to draw every stage to scale.
My readers no longer see the comparison, the targets or the expected value.
Those are premium and the reader has no licence. Readers without one see the free funnel of the same data, with stage order, conversions and leak ribbons, and Power BI shows its own licence note once; the visual is never blocked or watermarked. Side-by-side segments and small multiples show the first panel with its name. Assign the reader a licence in the Microsoft 365 admin center.
The leak ribbons or the What If card do not appear.
Both draw on the funnel only, not on a pyramid: set Funnel & Pyramid > Chart to Funnel. Leak Ribbons is off by default. With Segment Field As set to Side by side, the lanes carry no leak ribbons and no per-segment targets. Pipeline Coverage needs a quota: type it, or leave it at 0 to use the last stage's Target.
Moves into the chart, which is one tab stop; the first stage gets a dashed focus outline. The Table button is a separate tab stop.
Arrow keys
Moves to the previous or next stage.
Home / End
Jumps to the first or the last stage.
Page Up / Page Down
Jumps ten stages forward or back.
Enter or Space
Selects the focused stage and cross-filters the page. Hold Ctrl to add it to the selection.
Esc
Clears the selection.
Screen readers
The chart is labelled with its smart caption, such as "492 of 11.4K reach Won (4.3 % overall). The weakest step is Lead → Qualified at 43 %." A polite live region reads the focused stage with its name, value and share.
Data table
The Table button in the corner of the visual (Data Table > Table Button in the Visual, on by default) switches between the chart and an accessible table of every stage with its value and share, plus the comparison and the target when they are drawn; Other lists its members. Data Table > Open as Table starts the visual on the table.
Not colour alone
Accessibility > Patterns (Tell Items Apart Without Colour) gives each stage or segment its own fill pattern. Conversion changes carry their sign and points ("−13.1 pp"), significant steps carry stars, the comparison is a dashed outline and the what-if a dashed ghost, and leak ribbons are labelled with what they lose.
High contrast
In Windows high contrast mode the visual draws with the contrast theme's foreground, background and selection colours, without glow or tints, and always turns on the fill patterns.
Reduced motion
Accessibility > Reduce Motion, or the operating system's reduced-motion setting, turns off the transitions.
Focus outline and text size
Accessibility > Focus Outline Colour and Focus Outline Width set the outline around the focused stage (2.5 px by default; empty colour uses the theme's focus colour, high contrast always the system colour), and Minimum Text Size draws every label, legend, caption and footnote at least that large.
Context menu
Right-clicking a stage, a table row or the empty canvas opens the Power BI context menu for it.
Responsive layout
On a small tile the visual drops whole pieces instead of overlapping them: below 320 × 160 px no caption, footnote, findings or legend, below 480 px wide the legend moves to the bottom, and labels that do not fit are dropped whole, never cut. Every value stays in the tooltip and the data table.
Languages
The format pane, captions, footnotes, findings, tooltips, the data table and screen reader labels are available in 20 languages: Chinese (simplified and traditional), Czech, Danish, Dutch, English, French, German, Hungarian, Italian, Japanese, Korean, Norwegian, Polish, Portuguese (Brazil and Portugal), Slovak, Spanish, Swedish and Turkish. Numbers follow the report's locale.
Missing something?
Tell us what is missing.
A feature you need, a bug you hit, a visual that does not exist yet. Every message reaches the person who builds these visuals, and feature requests shape what ships next. We also build visuals to order.