Waffle chart in Power BI that adds up to 100: largest remainder, units and survey margins
A waffle chart is a 10 × 10 grid where every cell is one percent. It is the friendliest way to show a share: "37 of 100 customers are likely to reorder" reads at a glance, and nobody has to judge the angle of a pie slice. The trouble starts with the arithmetic. Round each share to a whole cell on its own and the grid often has 99 or 101 cells filled, and the chart that was supposed to make the whole obvious no longer adds up to it.
This article covers the rounding that fixes it, the unit grid for counts, when a pictogram reads better, and how to show the uncertainty of a survey share honestly, with examples from the fictional Helios Manufacturing customer survey.
Why the cells do not add up
Take five answers with these shares: Very likely 26.6 %, Likely 37.4 %, Neutral 18.6 %, Unlikely 11.4 %, Very unlikely 6.0 %. Rounded on their own they give 27 + 37 + 19 + 11 + 6 = 100. Fine. Now take 26.5 %, 37.5 %, 18.5 %, 11.5 % and 6.0 %: rounded half up, 27 + 38 + 19 + 12 + 6 = 102. Rounded down, 26 + 37 + 18 + 11 + 6 = 98. Either way the grid is wrong, and the labels next to it add up to 102 % or 98 %, which a careful reader will notice before they notice anything else.
Largest remainder: round so the total is exact
The largest-remainder method, also known as the Hamilton method, is one of the ways electoral systems turn votes into seats, and it fits cells just as well:
- Multiply each share by the number of cells and keep the whole part. 26.5 % of 100 cells gives 26.
- Count the cells still empty. In the example, 26 + 37 + 18 + 11 + 6 = 98, so two are left.
- Give them, one each, to the categories with the largest fractional parts.
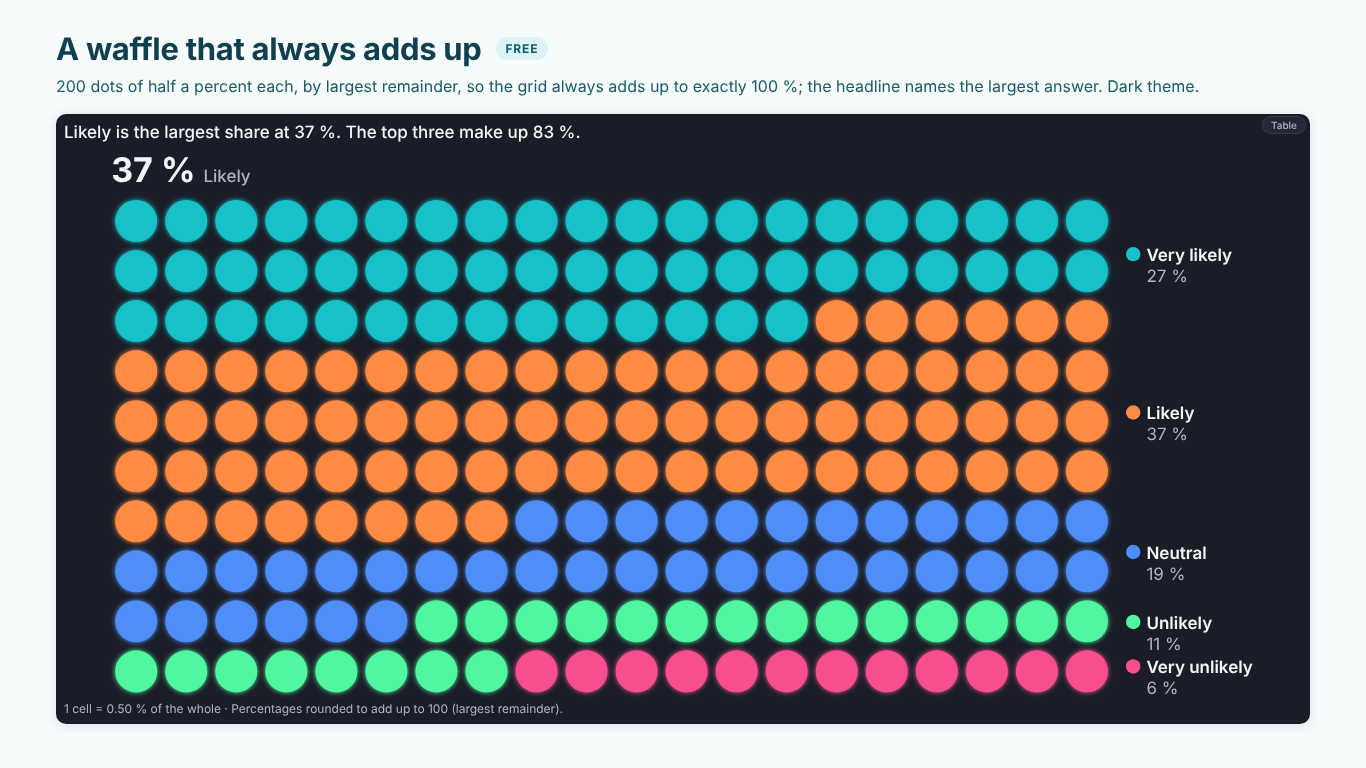
The result always fills the grid exactly, and no category is ever more than one cell away from its exact share. In DAX, as a measure evaluated per category:
Cells =
VAR GridCells = 100
VAR Total = CALCULATE ( [Respondents], ALLSELECTED ( Answers[Answer] ) )
VAR Exact = DIVIDE ( [Respondents], Total ) * GridCells
VAR Whole = INT ( Exact )
VAR MyRemainder = Exact - Whole
VAR AllWhole =
    SUMX (
        ALLSELECTED ( Answers[Answer] ),
        INT ( DIVIDE ( [Respondents], Total ) * GridCells )
    )
VAR Missing = GridCells - AllWhole
VAR LargerRemainders =
    COUNTROWS (
        FILTER (
            ALLSELECTED ( Answers[Answer] ),
            VAR e = DIVIDE ( [Respondents], Total ) * GridCells
            RETURN e - INT ( e ) > MyRemainder
        )
    )
RETURN
    Whole + IF ( LargerRemainders < Missing, 1, 0 )
Inside SUMX and FILTER, [Respondents] is a measure reference, so each row of ALLSELECTED gets its own category's count by context transition. Two categories with exactly the same remainder can both get an extra cell; if your data can tie, break the tie by name or by size and say which in the footnote.
Use the same numbers for the labels. A waffle whose cells show 26 and whose label says 27 % is worse than either alone.
Cells of half a percent, and cells of N units
The grid does not have to be 10 × 10. A 20 × 10 grid of 200 cells shows half percents, which helps when small answers would otherwise round to the same cell count. Change GridCells in the measure and everything else holds.
When the reader should see a count rather than a share, switch to a unit grid: one cell is a fixed number of things, such as 25 employees or 10 orders. The cells are the count divided by the unit, still rounded by largest remainder, and the grid grows as the count grows. Say the unit in the chart ("1 cell = 25 people"); without it a unit grid looks exactly like a percent grid and is read as one.
Waffle, isotype or icon array?
The same arithmetic drives three related charts, and each answers a slightly different question.
- A waffle shows parts of one whole. It works up to about six categories; beyond that the colours stop being distinguishable and the small ones belong in Other.
- Isotype rows show one row of icons per category, one icon per unit, with the last icon cut to the exact value. Headcount by department reads better as factories, laptops and trucks than as coloured squares, because the icon names the category before the legend does.
- An icon array puts all categories in one block of icons. It is the classic format for risk communication ("3 in 100 patients") and for a "1 in 4" headline on a cover page.
Whichever you use, keep icons as the data unit, not as decoration: one icon must mean one thing, and the chart must say what.
Two traps: overlapping percentages and parliaments
A waffle assumes the parts add up to one whole. Multiple-choice questions break that: if 64 % use email, 58 % use the portal and 31 % call, the answers add up to 153 %, and a single grid that fills by share of the sum draws something nobody answered. Show each answer in its own grid against 100 % instead.
Seat charts look like waffles but count whole seats. Round the vote shares to seats by largest remainder, draw the majority line, and compare with the previous composition in seats, not percentages: "Engineers Forum +1, Helios United −4" is the sentence a works council wants.
Survey shares come with a margin
A waffle of survey answers looks exact. It is not: 37 % Likely from 1,230 respondents is 37 % give or take about three points. With weighted survey data the uncertainty is larger than the raw sample size suggests, because weights reduce the information in the sample. The effective base (Kish) is:
Effective Base =
DIVIDE (
    SUM ( Responses[Weight] ) ^ 2,
    SUMX ( Responses, Responses[Weight] ^ 2 )
)
and the 95 % margin of error of a share p on that base, in the simple normal form:
Margin (pp) =
VAR p = [Share Weighted]
RETURN 1.96 * SQRT ( p * ( 1 - p ) / [Effective Base] ) * 100
For shares near 0 % or 100 %, or small bases, the Wilson interval behaves better than this normal approximation. Comparing two waves is a two-proportion z-test on the two effective bases; a move inside the margin is not news.
The same formula run backwards plans the next wave. To read every share to ± 3 points at 95 %, the worst case p = 0.5 needs n = 1.96² × 0.25 / 0.03² ≈ 1,067 respondents, times the design effect of the weights (sample size divided by effective base). With a design effect of 1.38 that is 1,473 respondents, not the 1,067 a calculator without weights suggests.
Doing it in one visual
With those measures, a waffle in Power BI usually means a matrix with conditional formatting or a grid of shapes, rebuilt for every question. We built SmartVisuals Waffle & Pictogram for this whole family of unit charts. Answer goes to Category and Respondents to Values. Percent grids of any rows and columns allotted by largest remainder, unit grids, dot matrix and icon cells, isotype rows with the last icon cut to the value, icon arrays, infographic cards that read "1 in 4", parliaments with a majority line, an icon per category in the format pane and a target per category are free, with no watermark.
What moved is premium: gained and lost cells against last period or plan; survey margins on the Kish effective base drawn as a band of cells, with the wave change tested on both waves' bases; the sample-size planner above; seat change and the coalitions that reach a majority; small multiples; and findings. Premium is $1.99 per user per month or $19 per user per year; readers without a licence see the free chart, never a blank one. The visual has been prepared for Microsoft Marketplace and is not published there yet. Its waffle and pictogram are also views of SmartVisuals Part-to-Whole, next to pie and donut, funnel, Marimekko and more.
The checklist
A unit chart holds up when:
- cells are rounded by largest remainder, so the grid and the labels add up to the whole;
- a unit grid says what one cell is worth;
- icons are data units with one meaning, not decoration;
- overlapping percentages get one grid each, not one shared whole;
- survey shares carry their margin on the effective base, and wave changes are tested before they are reported.
Try AI Chatbot for Free
Experience the power of conversational analytics in your Power BI reports. Get your free license in seconds - no credit card required.
Get Free License