Part-to-whole charts in Power BI: which chart for which question, and how to show what changed
"How is the whole divided?" is one of the first questions any report answers. Revenue by plant, headcount by department, the pipeline by stage, the market by player. Power BI gives you a pie, a donut, a treemap and a funnel out of the box, and most reports pick whichever was used last time.
The chart should follow the question instead. And whichever chart you pick, the more useful question usually comes one step later: not "how is it divided?" but "how did the division change?" This article goes through both: which part-to-whole chart fits which question, the rules that keep any of them honest, and how to compute and show a change in mix that a reader can trust.
The question decides the chart
All of these charts show parts of a whole. They differ in what the eye compares easily.
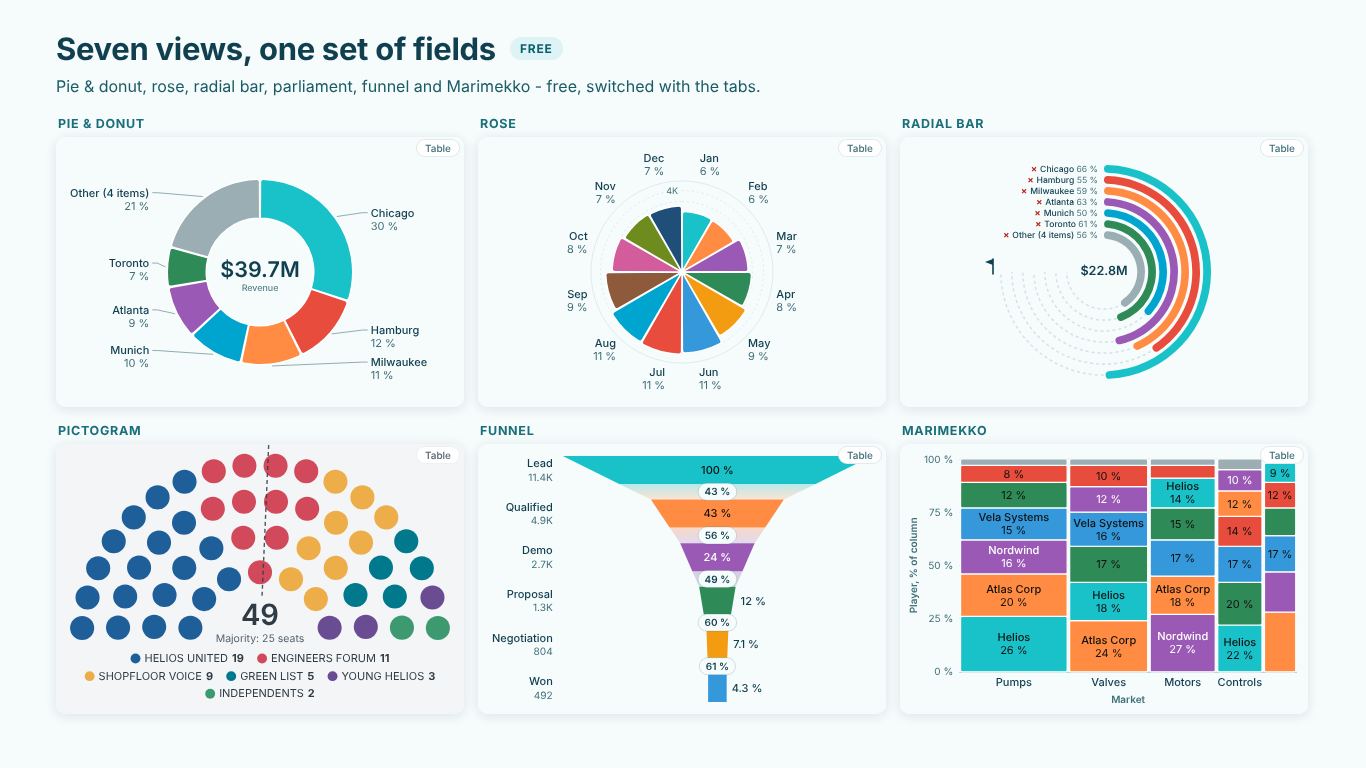
Pie or donut: one whole, a few parts. A pie answers "which part is biggest, and is it about a quarter, a third or a half?" It is good at that and at little else. With up to five or six parts it reads instantly; with twelve it turns into a colour-matching exercise. A donut is the same chart with room in the middle for the total.
Waffle or pictogram: shares people should remember. A 10 × 10 grid makes 23 % into 23 cells you can count, which is why "1 in 5 employees" lands better as five figures than as a slice. Use it for survey shares, headcount and anything that ends up in a presentation. A parliament (a hemicycle of seats) is the same idea for elected bodies, with a majority line.
Radial bar or progress rings: how far along is each part? When every part has its own goal (a plant's revenue target, a rep's quota), the question is not the share of the total but the share of the target. Rings that run to each target answer that; a pie cannot.
Rose: parts that form a cycle. Months of the year, hours of a shift, compass directions. The circle carries meaning, because December sits next to January and NNW next to N.
Funnel or pyramid: parts that are stages. Lead, qualified, demo, proposal, won. Each stage is a subset of the one before, so the interesting numbers are the conversion between steps, not the share of a total.
Marimekko: two splits at once. Markets as columns, whose width is the market size, and players as segments within each column. It answers "where do we play, and how big is each pond?" in one picture.
A quick test: if you cannot say which of these questions your chart answers, it is probably the wrong chart, or the wrong data for a part-to-whole chart at all. A bar chart is still the best way to compare many values precisely.
Five rules for any part-to-whole chart
Whatever the chart, the same five mistakes make it lie. They are worth fixing even with the native visuals.
- Sort. Largest first, starting at 12 o'clock and running clockwise. An unsorted pie forces the reader to compare slices that are not next to each other. Sort by a measure, not by the category name, unless the category is a cycle (months, hours) or a sequence (stages).
- Group the long tail into a labelled Other, and say what is in it. Ten slivers are not information. Keep the top five or six, fold the rest, and name the group "Other (4 items)" so the reader knows it is not a category of its own. The members should be one hover away.
- Make the labels add up to 100. Six equal parts are 16.67 % each; rounded one by one they become 17 % six times, which is 102 %. Readers notice. Largest-remainder rounding fixes it: round every share down, then give the missing points to the shares with the largest remainders.
- Size by area, not by radius, wherever area is what the eye reads. A rose petal whose length is proportional to the value has an area proportional to the square of the value, so twice the orders looks four times as big.
- Never hide what does not fit. A negative value or a blank cannot be part of a whole. Dropping it silently changes the total; taking the absolute value is worse. Leave it out and say so under the chart.
From "how is it divided?" to "how did it change?"
A single pie tells you that Chicago is 30 % of revenue. The review meeting wants to know whether that is more or less than last year, and whether Hamburg's slice really shrank.
There are two ways to state a change in a part, and they say different things:
- The value change: Hamburg's revenue fell from about $5.6M to $4.8M, which is −15 %.
- The share shift: Hamburg's share of the total fell from 16 % to 12 %, which is −4.0 percentage points (pp).
They can disagree. In a year when total revenue grows 13 %, a plant can grow 5 % and still lose share. For a mix question the share shift is the right number, and it is measured in points, not in percent: "−4.0 pp" means the share went from 16 to 12, while "−25 %" would mean the share itself shrank by a quarter, which is a different statement.
The DAX needs one rule: each period's share is taken over that period's own total.
Revenue LY =
CALCULATE ( [Revenue], SAMEPERIODLASTYEAR ( 'Date'[Date] ) )

Share =
DIVIDE ( [Revenue], CALCULATE ( [Revenue], ALLSELECTED ( Plant[Plant] ) ) )

Share LY =
DIVIDE ( [Revenue LY], CALCULATE ( [Revenue LY], ALLSELECTED ( Plant[Plant] ) ) )

Share shift (pp) =
( [Share] - [Share LY] ) * 100
ALLSELECTED keeps the slicers on the page (region, product line) but removes the plant on each row, so every plant is divided by the total the reader is looking at. Format Share shift (pp) with a sign and one decimal (+0.0;-0.0;0.0) and add " pp" in the label.
Three details decide whether the result can be trusted. First, a plant that is new this year has no Share LY; show it as "new", not as a shift from zero. Second, if you group the tail into Other, group both periods by this year's ranking, or Other will change membership between the two numbers. Third, the shifts of all parts add up to zero, so the biggest gainers and losers tell the whole story: Chicago +3.5 pp and Hamburg −4.0 pp are most of the movement in the Helios revenue mix.
Is the shift real?
Shares move every year by chance. If the measure is a count, such as orders, opportunities or survey respondents, a test can say whether the mix moved more than chance would explain. A chi-square test on the composition answers "did the mix change?", and a two-proportion z-test per part answers "did this part's share change?". On a funnel the same z-test asks whether a step's conversion changed: Demo to Proposal went from 62 % last year to 49 % this year on about 2,700 demos, which is far outside chance.
If the measure is an amount, such as revenue, there is no such test. A dollar is not an independent observation, and treating $39.7M as 39.7 million trials makes every change look significant. Say that the values are amounts and leave the significance out, rather than print three stars next to every slice.
Showing the change on the chart
Numbers in a table are fine for the analyst. On the chart, the comparison works best drawn the same way as the data:
- In a donut, last year as a thin outer ring around this year's, with "+3.5 pp" under each label.
- In a rose, last year's outline on every petal.
- In progress rings, a ghost arc where each ring stood last year.
- In a waffle, the cells gained and lost outlined.
- In a funnel, last year's stage widths dashed behind this year's.
A caption that states the biggest move in one sentence ("Biggest move: Hamburg −4.0 pp vs last year") does the rest. Keep Other out of the "biggest mover": a group whose members change is not a mover.
Doing it without the DAX
The measures above work in any visual, but they stop at numbers. Drawing last year's ring, rounding labels to 100 and keeping Other's members on hover is not something the native pie does.
That is what we built SmartVisuals Part-to-Whole for. It puts pie and donut, rose, radial bar, waffle, pictogram, funnel and Marimekko over one set of fields, switched with tabs, with the five rules above as defaults: sorted from 12 o'clock, a labelled Other with its members, labels rounded by largest remainder, roses by area, and negatives and blanks counted in the footnote. All seven views are free and never watermarked.
Premium (Compare) adds the comparison layer: put last year's measure in Compare and every view shows the share shift in points over each period's own total, with the ghost ring, outline or arc, the chi-square and z-tests when the values are counts, pace and projected landing in the rings, and a mosaic of two to four views side by side. It costs $4.49 per user per month or $45 per user per year; the single views, Pie & Donut, Rose, Radial Bar, Funnel & Pyramid, Marimekko and Waffle & Pictogram, are $1.99 each. The suite has been submitted to Microsoft Marketplace and is not published yet; the product pages will link to the listings once they are live.
If you stay with the native visuals, the checklist is short: pick the chart for the question, sort, name Other, make the labels add up, size by area, and show the change in points over each period's own total.
Try AI Chatbot for Free
Experience the power of conversational analytics in your Power BI reports. Get your free license in seconds - no credit card required.
Get Free License