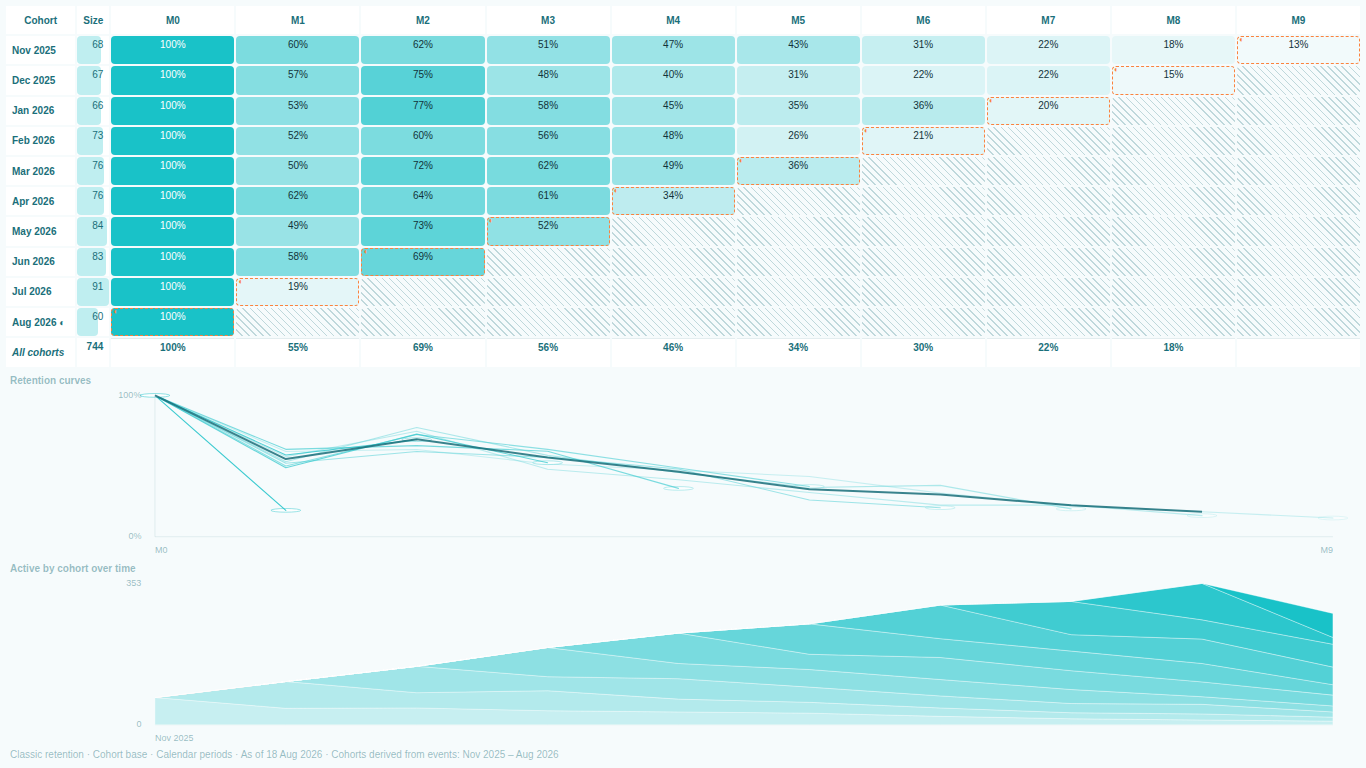
D7, D30 and rolling retention: three definitions that give three numbers
Two teams present D30 retention for the same app in the same meeting. One says 22 percent, the other says 41 percent. Both pulled from the same event table and both are right. They used different definitions of "retained", and neither chart said which. This article lays out the three definitions in use, computes all three on one small cohort so the divergence is visible, and pairs each with the denominator it belongs to.
The three definitions
Take a cohort: every user who first appeared in period 0. For each later period p, a user is "retained" under one of these rules.
Classic retention: the user was active in period p. Exactly that period. A user active on day 7 counts for D7; a user active on day 6 and day 8 does not. This is what most e-commerce and SaaS teams mean, and what most analytics platforms report as "Day N retention". It can go up as well as down from period to period, because a user who skipped day 7 can return on day 8.
Rolling retention: the user was active in period p or any period after it. A user who came back on day 12 counts as retained on day 7, because on day 7 they had not yet been lost. Rolling retention is monotonically non-increasing by construction: the set of users active on or after day 8 is a subset of those active on or after day 7. This is the survival-curve reading of retention, and it is what many mobile and games studios mean by D7 and D30, sometimes under the names "unbounded" or "return" retention. Its weakness is that the newest periods are always understated, because those users have had less time to come back.
Sequential retention: the user was active in period p and in every period before it, an unbroken chain. Miss one period and you are churned; come back later and you are a reactivation, not a retention. This is the frame for subscriptions and renewals, where "active" means "renewed" and a lapse is a real event with a real date.
The names vary between tools. "Bracket" retention (active anywhere in days 5 to 7) is a fourth variant some platforms report, and "N-day retention" is classic in one tool and rolling in another. What does not vary is that the three rules produce three different numbers from the same rows.
Ten users, three periods
A cohort of ten users, all active in period 0. Their activity in periods 1 to 3:
| User | P1 | P2 | P3 |
|---|---|---|---|
| U1 | yes | yes | yes |
| U2 | yes | yes | yes |
| U3 | yes | yes | |
| U4 | yes | yes | |
| U5 | yes | ||
| U6 | yes | ||
| U7 | yes | ||
| U8 | yes | yes | |
| U9 | yes | ||
| U10 |
Now count.
Classic. P1: U1, U2, U3, U4, U7, U9, six users. P2: U1, U2, U3, U5, U8, five. P3: U1, U2, U4, U6, U8, five.
Rolling. P1: anyone active in P1, P2 or P3, which is everyone except U10, nine users. P2: active in P2 or P3, which is U1, U2, U3, U4, U5, U6, U8, seven. P3: active in P3, five.
Sequential. P1: active in P1 (and P0, which is everyone), six. P2: active in P1 and P2, U1, U2, U3, three. P3: active in P1, P2 and P3, U1 and U2, two.
Against the cohort base of ten:
| Period | Classic | Rolling | Sequential |
|---|---|---|---|
| P1 | 60% | 90% | 60% |
| P2 | 50% | 70% | 30% |
| P3 | 50% | 50% | 20% |
At P2 the same ten users produce 30, 50 and 70 percent depending on the rule. At P3 classic and rolling coincide only because P3 is the last period observed; add a P4 and rolling P3 would rise while classic stayed put. That is the two-team meeting from the first paragraph, in miniature.
Which denominator each pairs with
Retention is a numerator over a denominator, and the definitions above only fix the numerator. Each rule has a natural denominator, and mixing them produces numbers that are computable and meaningless.
Classic and rolling pair with the cohort base: everyone in the cohort. "Of the users who joined in March, what share were active in month 3" needs the March cohort as the base. That is the standard triangle.
Classic can also be paired with the previous period: active in p divided by active in p minus 1. This is a period-over-period rate. On the example: P1 6/10 = 60 percent, P2 5/6 = 83 percent, P3 5/5 = 100 percent. The 100 percent at P3 is real arithmetic and says nothing about the cohort: five users happened to be active in P2 and five in P3, and they are not the same five. Period-over-period rates on classic numerators are noisy and best avoided unless the question really is about the flow between two adjacent periods.
Sequential pairs with the surviving base: the users still in the chain at p minus 1. That gives the renewal rate, which is what a subscription business wants. On the example: P1 6/10 = 60 percent, P2 3/6 = 50 percent, P3 2/3 = 67 percent. Over the cohort base instead, the same numerators give the survival share (60, 30, 20 percent). Both are useful; they are different questions, and the 67 percent and the 20 percent for P3 come from the same two users.
The full picture for P3 is therefore not one number but five: classic 50, rolling 50, sequential 20 on the cohort base, sequential 67 on the surviving base, and classic 100 on the previous period. Any of them can appear on a slide labelled "P3 retention".
Why the chart has to name its definition
The definitions differ by more than the numbers. Rolling retention answers "have we lost them", and it always draws a smooth downward curve, which is why people like it in decks. Classic answers "are they using it this period", and it bounces, which is why people distrust it when they expected a survival curve. Sequential answers "did they renew", and it drops fastest of the three, which is why it looks alarming next to either of the others.
None of that is visible from a coloured triangle. Two triangles built from the same events under different rules look like the same chart type with different data. So the rule and the denominator need to be written on the chart itself, in the subtitle or a status line, not in a measure name, a format pane setting or a footnote in the deck that gets cut. When a screenshot of the triangle travels to a board pack, its definition has to travel with it.
For anyone computing this in DAX, the practical implication is one measure per definition with the definition in the name (Retention classic, Retention rolling, Renewal rate) and a title that references it, plus a separate measure for the denominator so it can be shown as a column. Rolling retention in DAX also needs an "active in p or later" count, which compares each user's last event date to the period start rather than counting events inside the period.
Doing it in a visual
SmartVisuals Cohort Retention computes all three definitions from raw events (an entity and an event date, nothing else) and all the denominators discussed here: cohort base, previous period, surviving base and observed base. The active definition and the active denominator are named on the chart, in a status strip that stays with the visual, so the triangle in a board pack says what it is. Switching between classic, rolling and sequential is one dropdown, which is the fastest way to end the two-team meeting: put both numbers on screen with their names under them. The definitions, the denominators and the observation-window handling that keeps unfinished periods out of averages are all in the free tier.
Try AI Chatbot for Free
Experience the power of conversational analytics in your Power BI reports. Get your free license in seconds - no credit card required.
Get Free License