Visuals/Pl. IV

    News Ticker

    The broadcast news strip, fed from your data model

    Headlines, KPIs and alerts scroll in a seamless loop — horizontally like a TV lower third or vertically as a news-flash stack. 100 % free, no license, no watermark.

    Datasheet
    Status
    Available on Microsoft AppSource
    Price
    Free, no licence
    Licensing
    Nothing to assign. Every feature for every viewer.
    Data
    Computed inside Power BI. No external calls, no API keys, no telemetry.
    Visuals API
    5.11
    Accessibility
    Single-tab-stop keyboard navigation, reduced-motion Play button
    Languages
    English, Czech
    Works in
    Power BI Desktop, Service, Embedded
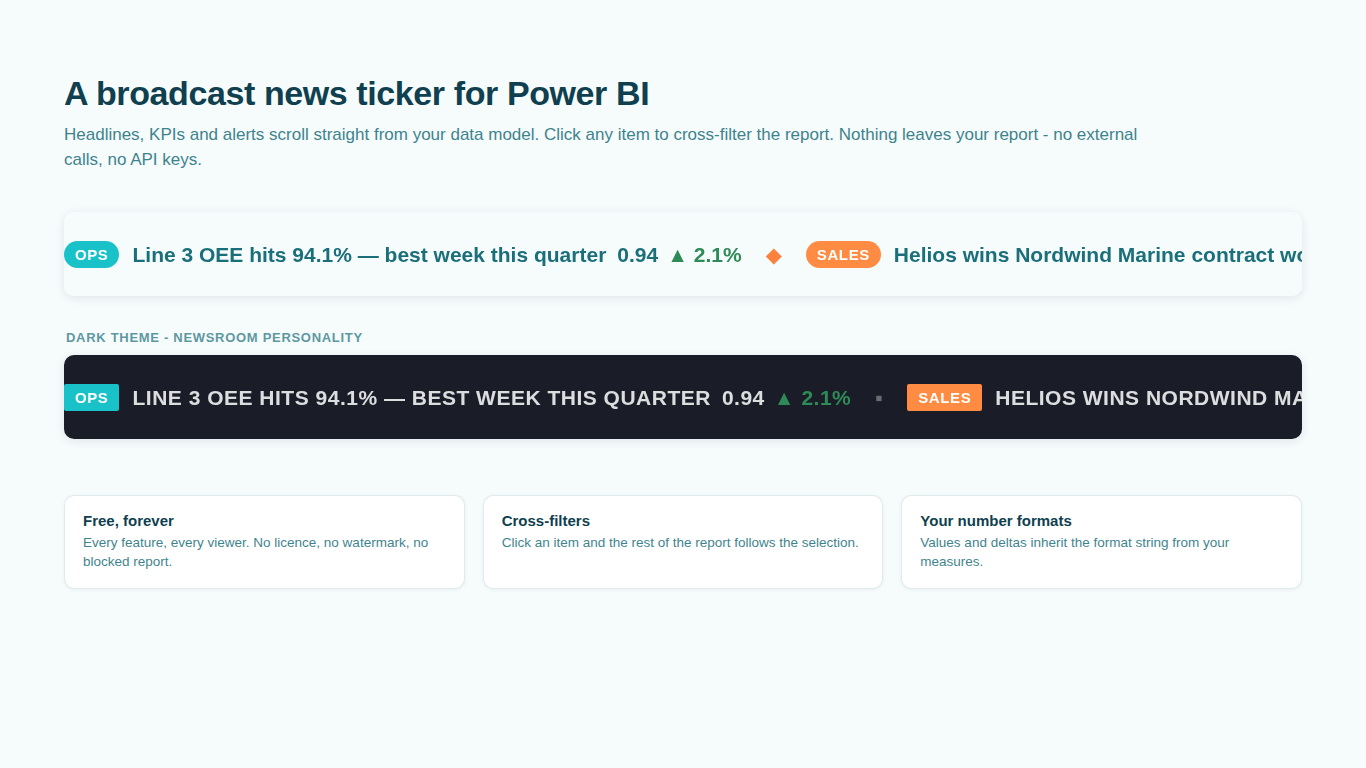
    Scrolling news ticker strip in a Power BI report
    Pl. IV  ·  News Ticker  ·  The broadcast strip: badges, headlines, values and deltas scrolling in a seamless loop.rendered from the shipped visual
    What it does

    SmartVisuals News Ticker brings the TV lower-third / stock-exchange strip to Power BI, fed entirely from your data model. Items follow the [badge] Headline [value] [▲/▼ change] pattern and scroll in a seamless loop — click any item to cross-filter the rest of the report.

    Four themes with distinct personalities — SmartVisuals with pill chips and beak-orange separators, Dark newsroom, Clean print and Slate. No fields at all? Type an announcement in the format pane and the ticker runs on that alone.

    Everything in the box

    Every feature, for every viewer.

    No licence, no plan, nothing to assign. The whole visual is free and stays that way.

    Includedevery viewer
    • Broadcast strip or news-flash stackHorizontal marquee or vertical mode, with 1–5 scrolling rows and per-row lanes.
    • Badges, values and deltasShort category chips (BREAKING, OPS, SALES…) auto-colored per badge and labeled with your real badge names, values honoring the measure's format string, and ▲/▼ change arrows — invertible for metrics where down is good.
    • A flash when numbers moveItems flash when their values change, and per-item images (offline data URIs) put a logo next to each headline.
    • Viewer-friendly by designPause button, report-highlight dimming, edge fade, reduced-motion support (static strip), high contrast, and a static mode for clean exports.
    • Full keyboard accessOne tab stop for the whole ticker: arrow keys move between items, Home/End jump to the ends, Enter cross-filters, Escape clears. Focus holds the strip still.

    A news ticker for Power BI, fed from the data model

    Every item on the strip is a row in your model: a Headline, an optional Badge such as OPS or SALES, an optional Value formatted with the measure's own format string, and an optional Change that drives the up or down arrow and its colour. Add an Image field with an embedded data URI and each headline carries a logo. The ticker updates whenever the data refreshes, so a sales alert on the strip is the same number as in the table beneath it.

    No fields at all? Type an Announcement into the format pane and the ticker runs on that alone, which makes it a useful banner for maintenance notices and release notes.


    Broadcast strip or news-flash stack

    The horizontal mode scrolls items in a seamless loop like a television lower third or a stock-exchange strip, with an edge fade and a pause button for viewers. The vertical mode stacks headlines like a news flash. One to five lanes let a factory floor screen carry operations, quality and sales at once, and a flash highlights an item the moment its numbers move.

    Cross-filtering and keyboard access

    Click a headline and the rest of the report filters to it; report highlighting dims the other items. The whole ticker is one keyboard tab stop: arrow keys move between items and wrap around, Home and End jump to the ends, Enter or Space cross-filters, Escape clears the selection, and focus holds the strip still so a keyboard user is never chasing moving text. When the operating system asks for reduced motion the strip renders static with a Play button, and Windows high-contrast mode is honoured.

    Exports and screens that cannot scroll

    A static mode lays the items out without animation for clean PDF and PowerPoint pages, and it is the right choice for a report page that gets printed. On a wall screen the loop runs indefinitely without a refresh.

    Why another scrolling-text visual

    The popular scrolling-text visuals on AppSource were compiled against Power BI API versions from 2017 and 2018. They still work, but they cannot show the modern format pane, they have no keyboard model beyond a single focus ring, and they carry a text box, not a news feed: no badges, no values with format strings, no per-item deltas. SmartVisuals News Ticker targets API 5.11, ships with English and Czech strings, and is free with no licence and nothing to configure.

    Where it gets used

    Operations screens on the shop floor, sales alerts in a management dashboard, KPI headlines above an executive summary page, and announcements in shared reports. Anywhere a report needs a line of moving context without giving up a full visual's worth of space.

    Getting started

    From empty canvas to first chart.

    1. 01

      Map a text column to Headline — the ticker starts scrolling.

    2. 02

      Add Badge, Value, Change and Image fields as your feed needs them.

    3. 03

      Or skip fields entirely: type an Announcement in the format pane and the ticker runs on that alone.

    4. 04

      Pick a theme, set rows and speed, and you're done — everything is free.

    Get News Ticker

    Two ways in.

    Installation instructions for both paths are on the download page.

    Microsoft AppSource (recommended)

    Reviewed by Microsoft, updates automatically, licences assigned in the Microsoft 365 admin center.

    Open AppSource

    Direct download (1.0.2.0)

    .pbiviz package, import into Power BI Desktop or Service, does not auto-update.

    Download .pbiviz
    Questions

    Asked before you did.

    More questions? See support or write to hello@smartvisuals.io.

    Missing something?

    Tell us what is missing.

    A feature you need, a bug you hit, a visual that does not exist yet. Every message reaches the person who builds these visuals, and feature requests shape what ships next. We also build visuals to order.

    Also in the family