
Survey results in Power BI without exporting to SPSS
Most insights teams keep two toolchains: the survey platform or SPSS for the tables, and Power BI for the dashboard. The tables carry the statistics the client expects, weighted percentages, significance letters, effective bases, and the dashboard carries none of them, because DAX has no notion of a column proportion test. So the dashboard becomes a picture of the deck, refreshed by hand.
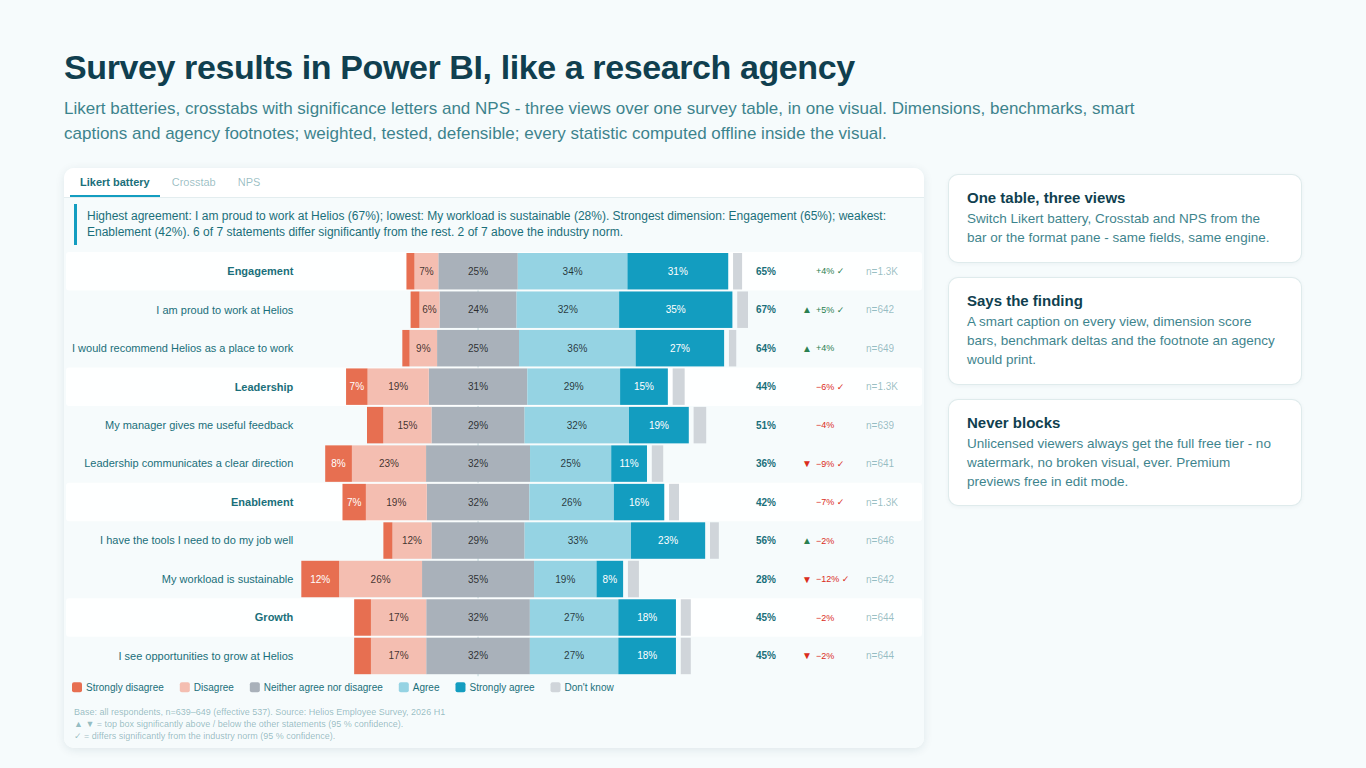
SmartVisuals Research puts the statistics inside Power BI. One survey table in long format, one visual, three views: a Likert battery, a banner crosstab and an NPS panel, switched inside the visual and sharing the same fields. Weighting, effective bases, significance letters, nets and means come from one engine, the same engine that powers the standalone SmartVisuals Likert, Crosstab and NPS visuals.