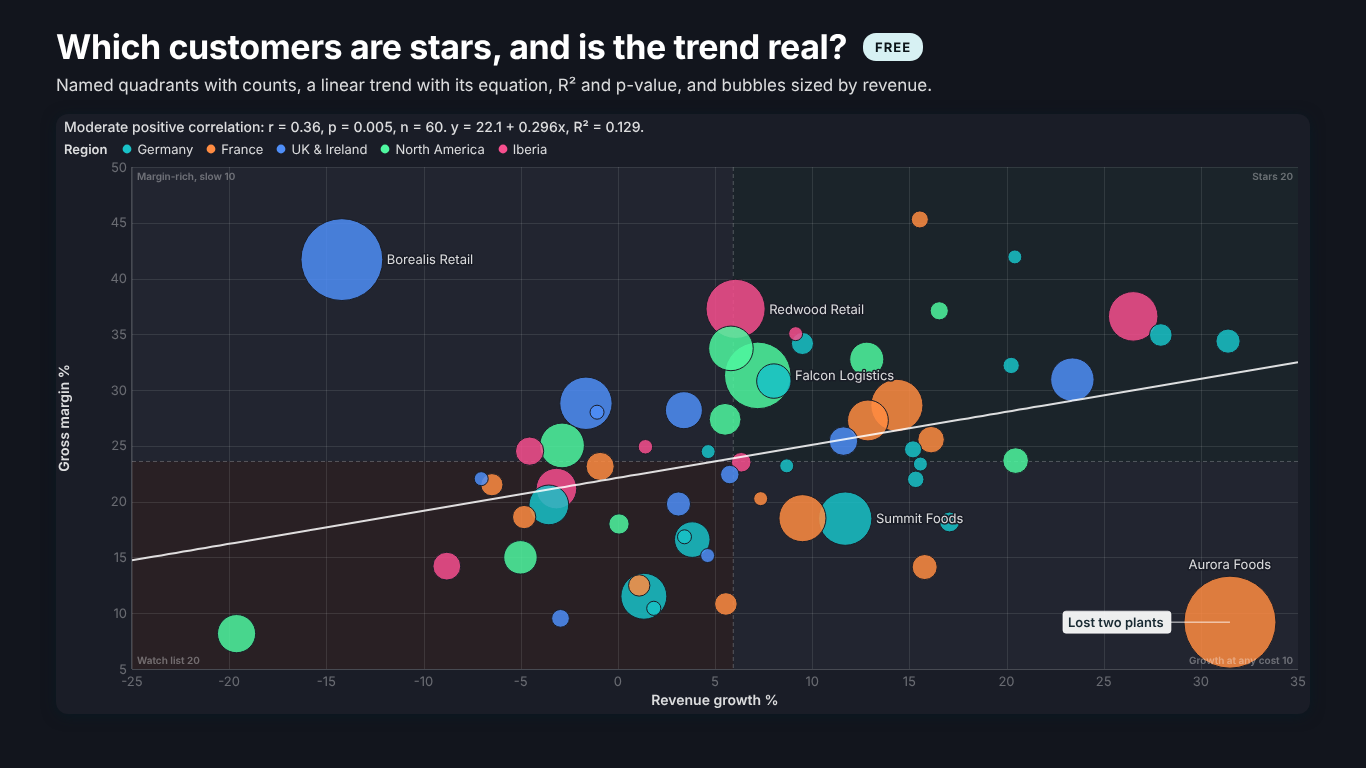
- The visual only shows the setup guide.
- X and Y are required. The guide lists what is bound and what is missing. If both are bound and the message says every row is missing a numeric X or Y, the measures return blanks or text for every row in the current filter.
- The footnote says some rows without numeric X and Y were excluded.
- Those rows have a blank or non-numeric X or Y and are left out of the chart and of every statistic. Check the measures for blanks in the current filter.
- Points disappeared when I switched an axis to logarithmic.
- A log axis cannot show zero or negative values, so those points are hidden and the footnote says how many. Set X Axis > Scale or Y Axis > Scale back to Linear, or filter the non-positive rows out on purpose. An axis Minimum of zero or less is ignored on a log axis.
- The trend line is missing.
- Check Trend Line > Show. A fit needs at least three points with numeric X and Y, and X values that are not all equal (per legend value when Per Series is on). Exponential fits use only points with Y above zero, and power fits only points with X and Y above zero; if too few are left, no line is drawn.
- Bands, zones or Spearman show in edit mode but not for my readers.
- Those are Premium. In reading view without a licence each one falls back to its free behaviour: Spearman and Kendall to Pearson, other fits to linear, zones to quadrants (if Quadrants is on), small multiples to one panel, weighted fits to ordinary least squares; bands, the coefficient table, influence diagnostics, clusters, density and movement arrows are not drawn. Power BI shows its own short licence note; the chart is never blocked or watermarked. Assign the licence in the Microsoft 365 admin center and reload the report.
- The legend disappeared.
- Points are coloured by cluster (Clusters > Color Points By Cluster) or by quadrant or zone (Quadrants > Color Points By Quadrant / Zone), so the legend colours no longer apply and the legend hides.
- The play axis does not move.
- Reduce motion is on: Accessibility > Reduce Motion is Always, or it is Follow system setting and the operating system asks for reduced motion. Play then steps one frame per press. The report opens on the latest frame unless Play Axis > Start Frame is First.
- Custom zone cuts are read wrongly.
- X Custom Cuts and Y Custom Cuts are lists separated by commas, semicolons, spaces or |, so write decimals with a dot: 1.5; 3 gives two cuts, while 1,5 gives cuts at 1 and 5. Axis Minimum and Maximum do accept a decimal comma.
- An image in a point does not show.
- Only data:image/...;base64 values in the Image field are drawn. Web addresses are ignored on purpose: the visual makes no external calls.
- The zone table, coefficient table or migration matrix is missing.
- Side tables need the full layout (at least 560 × 300 px) and, in reading view, a licence. The migration matrix also needs Zones (Beyond 2×2) on. The Movement vs Prior Period card appears only once both Prior X and Prior Y are bound.